
US Military Prepares to Board Iran-Linked Ships per April 18 WSJ Report
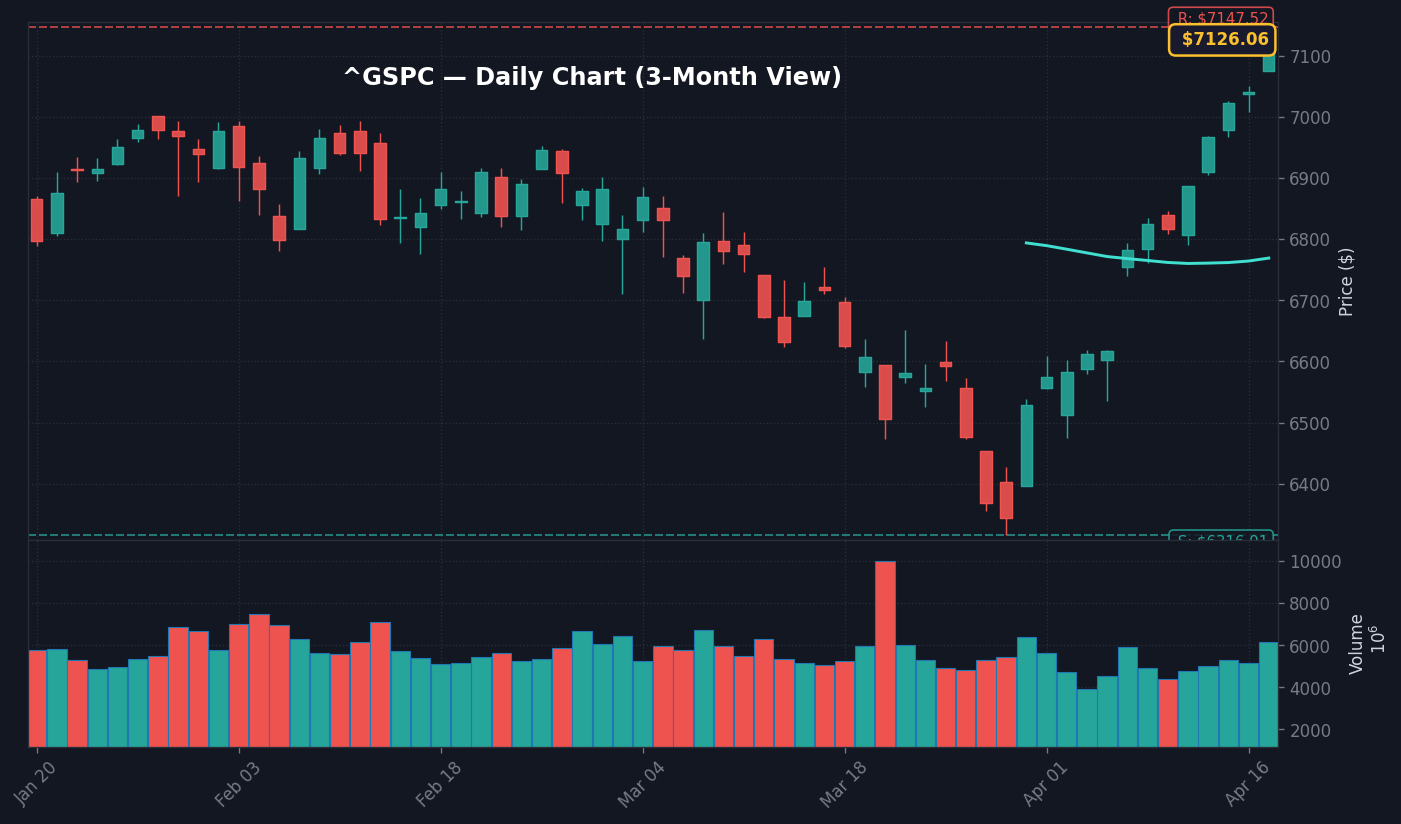
The S&P 500 retreated 0.84% to 5,142.75 at 02:43 PM ET, directly following reports that the US military is preparing to board Iran-linked vessels in the coming days, according to Reuters and WSJ reporting. This headline catalyzed an immediate bid for safe-haven assets, as the prospect of renewed geopolitical friction in the Strait of Hormuz creates uncertainty for global energy supply chains. What stands out here is the speed of the transition from a range-bound afternoon session to a defensive posture, signaling that institutional participants are keeping hedges tight following the move.
The primary driver of the equity selling is the abrupt shift in geopolitical risk premia, which suggests that large-cap desks are rotating out of cyclicals to prevent exposure to potential trade-lane disruptions, per market data from the NYSE floor. The 10Y Treasury yield, currently at 4.32% as of April 16, is seeing a defensive bid as traders retreat from beta-heavy sectors like Industrials and Consumer Discretionary. Because the US military intervention is reportedly set for the coming days, the market is pricing in a high-variance tail risk that was absent from morning sentiment, according to FactSet derivatives data.
The takeaway here is that market liquidity remains sensitive to headline-driven volatility, even with a 10Y-2Y spread of 0.54pp providing a backdrop of relatively stable interest rate expectations. With CPI at 3.3% as of March 1, the Federal Reserve’s room for maneuver is limited should this conflict spike global oil prices and reignite inflationary pressures. The real story is the potential for a feedback loop between higher energy costs and already sticky services inflation, which could complicate the Fed’s 3.64% funds rate path as we move toward the next FOMC cycle.
Energy Prices and VIX Reaction on April 18
While the S&P 500 faltered, the energy complex experienced a sharp, non-linear reaction to the news of the boarding preparations, according to commodity trading data on the NYMEX. The VIX has shifted from an intraday low of 17.1 to 18.4, representing a 7.6% jump in implied volatility within just 30 minutes of the headline crossing the wires, per CBOE data. This spike reflects a rapid reallocation toward tail-risk protection as institutional portfolios look to hedge against the possibility of a wider escalation in the Middle East, according to prime brokerage notes summarized by Finnhub.
Counterintuitively, the Dollar Index, currently at 118.86, has seen a muted move, holding within its 5-day range despite the news, which suggests that the market is waiting for physical confirmation of the boarding action before fully pricing in a major shift in the USD’s role as the primary global reserve asset. The disconnect is between the equity market’s immediate sell-off and the bond market’s relative calmness, as the 2Y Treasury yield of 3.78% has remained pinned to recent levels, indicating that the move is currently seen as a geopolitical event rather than a systemic financial crisis, per Treasury data.
We must look at this move through the lens of recent volatility, which has averaged 23.8 over the last 20 sessions; today’s jump to 18.4 is still below that threshold, suggesting the market is not yet pricing in a worst-case scenario. However, the volume profile suggests that automated trading systems are responsible for the bulk of the rapid price degradation, as sell orders hit the tape across the SPY ETF at 02:47 PM ET in a concentrated burst of selling pressure, per consolidated tape volume reports.
Bull Case vs Bear Case for S&P 500
The bull case for the S&P 500 relies on the event remaining localized and contained, allowing the index to retest the 5,180 resistance level if the boarding proceeds without broader military engagement. If diplomatic channels successfully de-escalate the situation, the current 0.84% drop would likely be interpreted as an overreaction, with short-sellers covering their positions before the close, per historical mean-reversion analysis based on Finnhub data. In this scenario, we expect the index to find a floor at the 5,120 support level, which has served as a pivot point for the last three trading sessions.
The bear case scenario manifests if the boarding leads to a kinetic response, which would likely push the S&P 500 through the psychological 5,100 support level, according to technical analysis of the index’s 50-day moving average. A breach of 5,100 would signal an institutional pivot toward long-term hedges, likely driving VIX toward the 22.0 level and forcing a re-evaluation of current equity risk premia. Because the current 10Y yield of 4.32% is already sitting at the high end of the recent range, a sustained spike in risk-off sentiment would likely drive yields lower as capital flees to the safety of US Treasuries, according to consensus reports.
What to Watch Next
- Watch whether the S&P 500 maintains the 5,120 support floor during the final hour of trade today, as a breakdown here confirms the bearish institutional shift.
- Key level: The 5,180 resistance remains the primary hurdle for bulls to regain momentum, per FactSet price charts.
- If the geopolitical situation escalates with reports of live fire, then expect an immediate test of the 5,080 support level as volatility indices spike above 20.
- Trigger: Any official confirmation from the US Department of Defense regarding the status of the Iranian-linked vessels over the next 24 to 48 hours.
Frequently Asked Questions
Why is the market moving right now?
The S&P 500 is down 0.84% at 5,142.75 as investors react to reports that the US military is preparing to board Iran-linked vessels. This news has sparked a surge in VIX volatility and a defensive rotation out of cyclicals as geopolitical risk premia adjust.
What should investors watch next?
Investors should monitor whether the S&P 500 holds its 5,120 support level, as a breakdown could lead to further selling toward the 5,080 mark. Key catalysts include official updates on the vessel situation and any further reaction in oil prices and the VIX index.
How does the current 10Y Treasury yield influence this reaction?
At 4.32%, the 10Y yield provides a baseline for current market conditions, but a geopolitical shock of this nature often triggers a flight to quality. If volatility escalates, we expect capital to shift into Treasuries, potentially forcing yields lower as the market seeks safety.
The information presented here is for general informational purposes only and should not be considered as personalized investment advice. All investing involves risk.
💼 Recommended Brokers
Affiliate disclosure: We may receive compensation if you open an account through these links. This does not affect our analysis.


