
Quick answer:
Market Snapshot As of 2026-04-13 18:12 ET (intraday change) S&P 500 $679.46 ▼ -0.07% Nasdaq 100 $611.07 ▲ +0.14% Russell 2000 $261.30 ▼ -0.25% VIX 21.33 ▲ +10.92% US 20Y $86.49 ▼ -0.24% Dollar 98.96 ▲ +0.31% Gold $437.13 ▼ -0.18% Home Breaking News Market Alert: Volatility Spikes as 10-Year Yield Breaches 4.32% Threshold Updated: April 13, 2026 at 05:12 AM ET · Reading time: 2 min · Author expertise: Small-Cap Equity Analyst Why trust us: We separate factual market inputs from interpretation and link our process below. Methodology · Data sources · Editorial policy 10-Year Treasury Yield Hits 4.32% as S&P 500 Stalls at 6,816 According to Yahoo Finance, At 05:12 AM ET on April 13, 2026, the 10-year Treasury yield surged to 4.32%, marking a 0.56% increase that is recalibrating risk appetite across global desks.
10-Year Treasury Yield Hits 4.32% as S&P 500 Stalls at 6,816
According to Yahoo Finance, At 05:12 AM ET on April 13, 2026, the 10-year Treasury yield surged to 4.32%, marking a 0.56% increase that is recalibrating risk appetite across global desks. This move triggered a sharp bifurcation in the equity market, with the S&P 500 dipping 0.11% to 6,816.89 while the VIX index spiked 10.87% to 21.32. The rotation out of high-multiple software and cybersecurity names intensifies as discount rates climb.
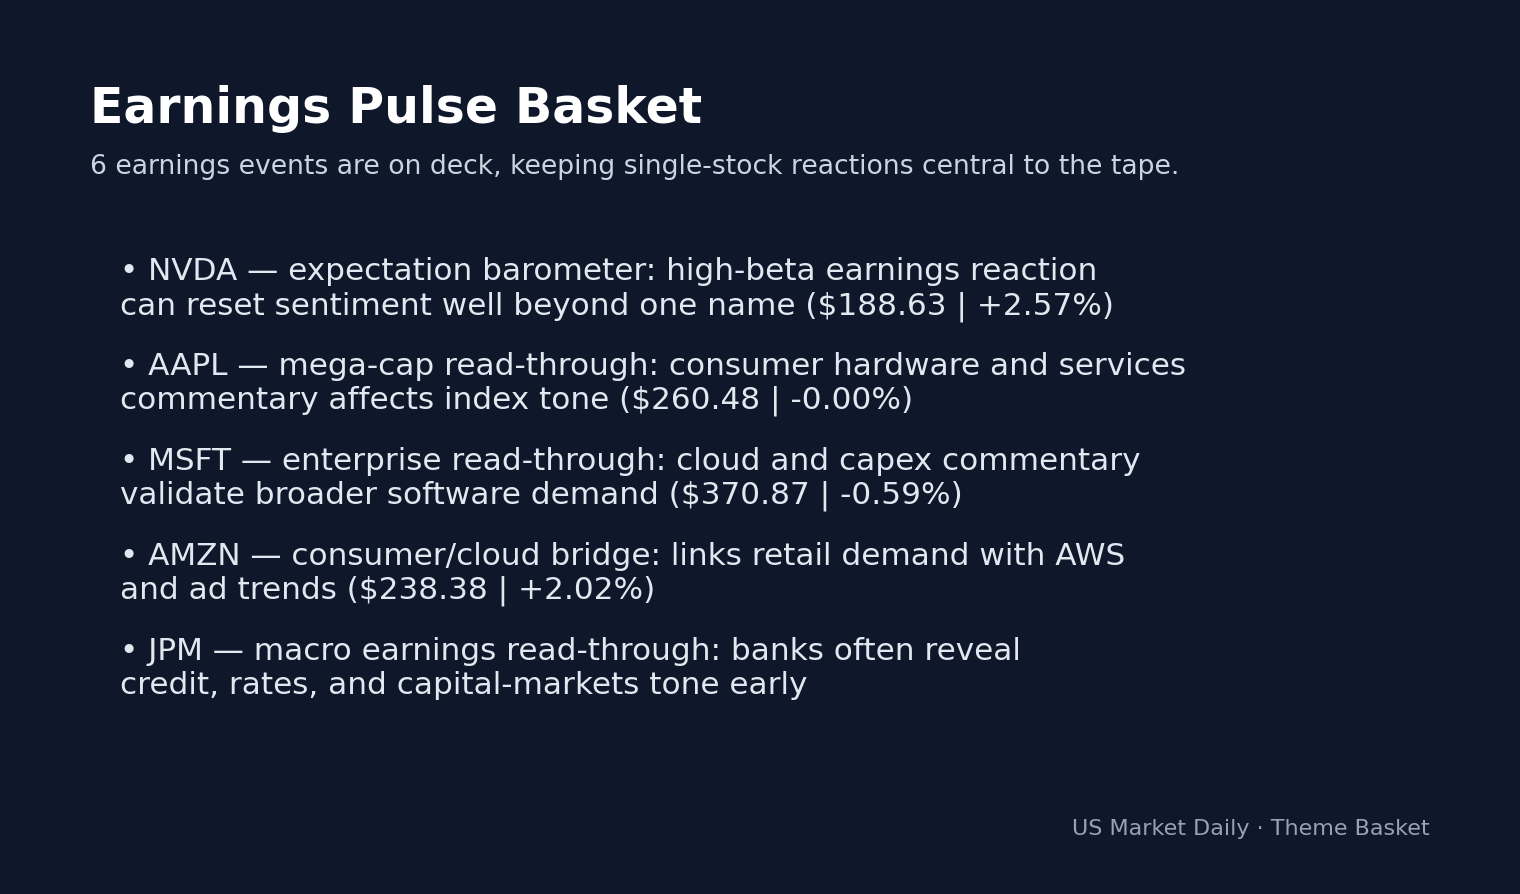
According to Yahoo Finance, The tech sector shows resilience, with the Nasdaq Composite posting a 0.35% gain to 22,902.89. This divergence reflects a market pricing a distinction between cash-generative hardware leaders and growth-dependent software platforms. Hardware-adjacent NVDA leads the charge, trading up 2.55% at $188.63, whereas cloud-software names such as NOW dropped 7.58% and NET plummeted 13.50%. Capital is migrating toward tangible supply-side infrastructure as the 10-year yield signals an aggressive re-pricing of terminal rate expectations.
Rotation Analysis: 1.09% Financials Drawdown vs. 2.55% NVDA Gain
The current regime is defined by a flight from defensive sectors, as Financials (-1.09%) and Healthcare (-1.35%) drag broader indices lower. Rising bond yields create a difficult environment for the S&P 500 to maintain momentum above the 6,800 level. Traditional yield-sensitive sectors like Utilities (-0.40%) and Consumer Staples (-1.29%) face immediate selling pressure as the interest rate environment squeezes the ‘bond proxy’ trade.
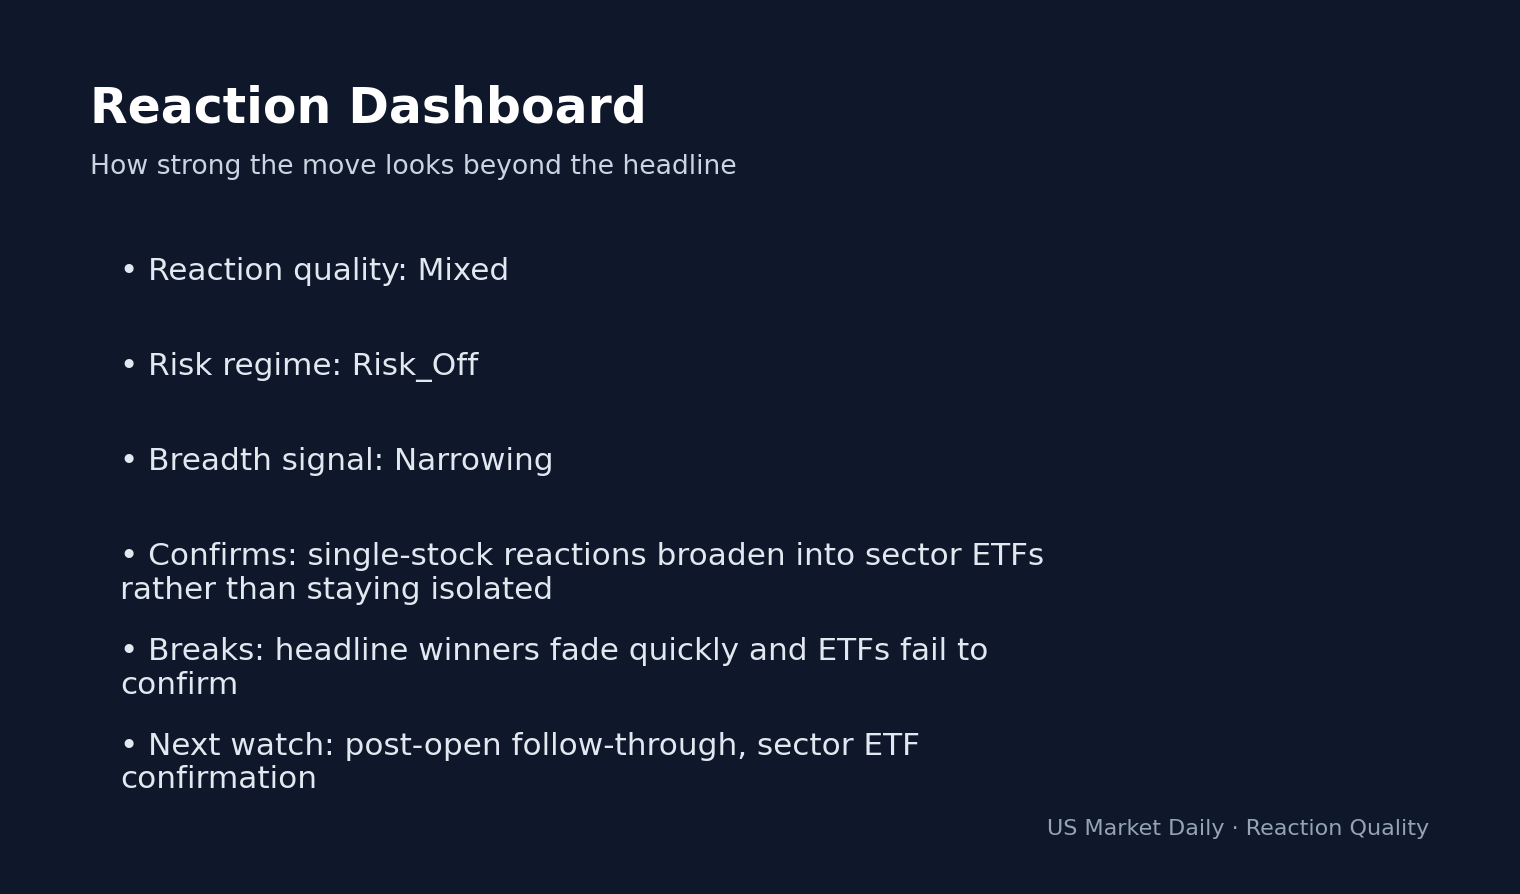
Market volatility is reinforced by options pricing that implies a 1.53% move across upcoming earnings events. The underlying dispersion between hardware and software indicates that the cost of capital constrains high-beta tech that relies heavily on future cash flows. Failure to maintain current hardware premiums will accelerate broader index volatility.
Key Watchpoints:
- Watch whether the 6,800 S&P 500 support level holds during the first hour of trading.
- Monitor the 4.35% yield threshold on the 10-Year Treasury as the next technical barrier.
- If NVDA breaks the $190 pivot, it signals a shift in broader tech sentiment.
Disclaimer: This briefing is for informational purposes only and does not constitute financial advice or investment recommendations. All market data is provided as of April 13, 2026, and is subject to rapid change.
Frequently Asked Questions
Why is the market moving right now?
The market is reacting to a 0.56% spike in the 10-year Treasury yield, which hit 4.32% early this morning. This rise in rates is driving a rotation away from defensive and high-multiple software stocks, while hardware-focused companies continue to see buying interest.
What should investors watch next?
Investors should watch whether the S&P 500 can hold the 6,800 support level during the regular session. Additionally, monitor if the 10-year Treasury yield attempts to breach 4.35%, as further upside could pressure high-beta technology valuations.
Why is the software sector struggling today?
Software stocks are underperforming because they are highly sensitive to discount rates, which have increased following the spike in bond yields. As borrowing costs rise, the present value of future earnings for growth-dependent firms like NET and NOW is being recalibrated lower by market participants.
Data sources: Yahoo Finance · SEC EDGAR · Simply Wall St. · Zacks
📚 Related Articles
- Why Is USO Up 11.4%? Iran War & Powell Pivot Fuel Rally
- GOLD Surges 3.2% as Safe-Haven Demand Spikes Despite Rally
- ALK Stock Soars 10.7% After Earnings Beat. What Wall Street Missed?
- XLRE Jumps 1.61% as Yields Fall. What Energy’s Oil Rally Missed?
- VIX Explodes 13.16% to 31 on Oil Spike. Crash Signal?
Explore the Fed & Rates Playbook
This article fits into our Fed & Rates topic cluster and is meant to serve why stock is moving.
Evergreen angles to build next
- What Bond Yields Mean for Tech Stocks — Explain how Treasury yields ripple through valuations, growth stocks, and risk appetite.
- How to Read a Fed Day Market Reaction — Break down how equities, yields, and the dollar respond when the Fed shifts expectations.
- How to Read an Earnings Implied Move — Show how options pricing frames expectations into an earnings event.
Cluster-adjacent reads
Fed & Rates Playbook
A hub for understanding how Fed expectations, Treasury yields, inflation data, and duration-sensitive sectors interact.
Suggested reading path
- Start with the Fed reaction explainer
- Move to bond yields and sector impact
- Then connect daily event notes back to the hub
Core evergreen guides in this hub
- What Bond Yields Mean for Tech Stocks — Explain how Treasury yields ripple through valuations, growth stocks, and risk appetite.
- How to Read a Fed Day Market Reaction — Break down how equities, yields, and the dollar respond when the Fed shifts expectations.
Glossary anchors: duration sensitivity, real yields, terminal rate, policy repricing
This article is for informational purposes only and does not constitute financial advice. Always do your own research before making investment decisions.


