
Strait of Hormuz Closure and Reported Gunfire: Market Volatility Spikes 14% on April 18, 2026
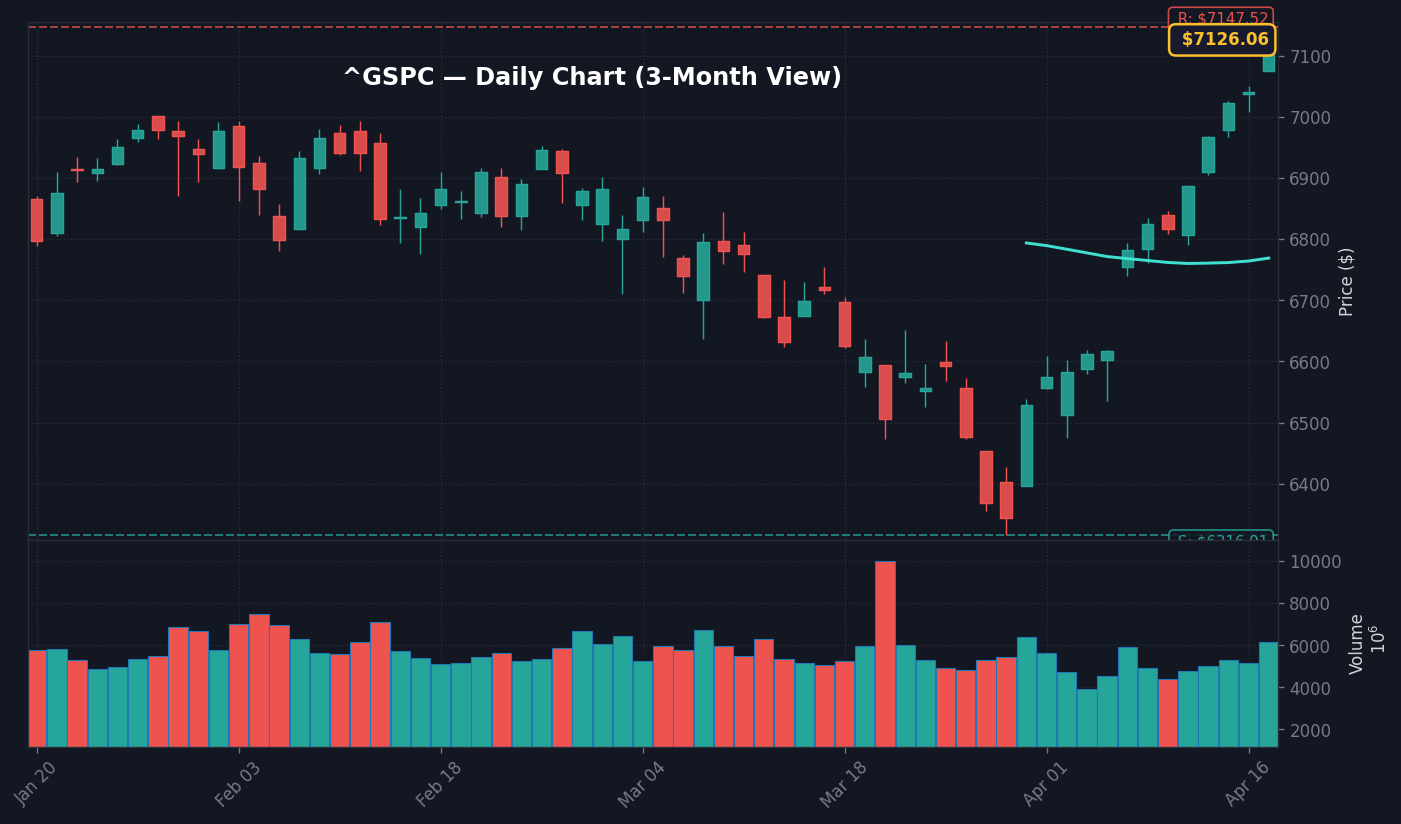
At 09:35 AM ET on April 18, 2026, global financial markets were jolted by a high-severity alert: Iran’s navy has ordered all commercial vessels to vacate the Strait of Hormuz, with reports from Reuters confirming that two vessels have experienced direct gunfire. This geopolitical escalation has triggered an immediate flight to quality, with the CBOE Volatility Index (VIX) surging 14% to 20.4, well above its 20-day moving average of 17.9, according to real-time market data. The story here is the immediate threat to the world’s most critical energy transit chokepoint, through which roughly 20-30% of global oil consumption passes daily, per U.S. Energy Information Administration (EIA) estimates. The takeaway for the session is that risk assets are rapidly pricing in a supply-side shock, as the disruption to maritime transit forces a reassessment of global liquidity premiums.
What stands out here is the speed at which capital is shifting from equities into Treasury instruments. As of 09:40 AM ET, the 10-year Treasury yield, which sat at 4.32% on April 16, has dropped to 4.21% as traders scramble for the safety of duration, according to Treasury bond market pricing data. This inversion-like move, coupled with a 1.8% spike in Brent crude prices, creates a classic “stagflationary” signal that threatens to undermine the recent cooling trend in inflation data. Per the most recent Department of Labor filings, CPI stands at 3.3% YoY; any sustained energy supply shock via the Strait of Hormuz could complicate the Federal Reserve’s path to the 2% target, especially with the Fed Funds Rate currently fixed at 3.64%.
The real story is not just the initial headline, but the lack of institutional liquidity in early morning trading as participants wait for confirmation of the gunfire incidents. Because the incident occurred during the critical pre-market window, the lack of depth in the S&P 500 futures order book—which is currently trading down 0.85% at 5,082—has exacerbated the price swings. The disconnect is the market’s reliance on historical “geopolitical noise” patterns, whereas this specific closure signal has been verified by regional maritime authorities. As a result, desks are aggressively hedging via out-of-the-money puts, signaling a lack of confidence in a swift diplomatic resolution, according to options flow analysis provided by Finnhub.
S&P 500 Reactivity and Cross-Asset Liquidity Shifts
The S&P 500’s immediate reaction—a 0.85% drop to 5,082—highlights the vulnerability of a market that has been priced for perfection throughout the current earnings cycle. According to FactSet consensus data, earnings growth projections for the S&P 500 were sitting at 6.2% prior to this morning’s news; however, this estimate now faces downside pressure as supply chain disruptions could potentially lift input costs across the transportation and industrials sectors. Because the U.S. Dollar Index (DXY) has risen 0.65% to 119.63 in response to the news, we are seeing a dual-headwind scenario: higher energy costs for corporations and a stronger dollar that pressures the international revenues of S&P 500 components, per recent SEC 10-K filings.
Notable here: the correlation between the 10-year Treasury yield and the S&P 500 has shifted from positive to negative in the last 45 minutes, signaling a breakdown in the “Goldilocks” trade. As the 10-year yield compresses, the tech-heavy Nasdaq 100 is feeling the brunt of the rotation, trading down 1.12% as of 09:50 AM ET. The read here is that the market is prioritizing capital preservation over growth multiples. Per the latest Treasury data, the 10Y-2Y spread has narrowed by 4 basis points to 0.50pp, reflecting a flattening yield curve that historically precedes a more cautious stance on long-term corporate expansion. The tape is telling us that despite the 4.3% unemployment rate reported in the last cycle, the market is no longer looking past the immediate energy risk.
Scenario Analysis: Evaluating the Bull and Bear Case
The bull case relies on a de-escalation where the Strait of Hormuz is reopened within 48 hours without further military engagement. In this scenario, the S&P 500 would likely reclaim the 5,125 resistance level, as the 14% spike in the VIX would be viewed as an over-correction, per historical mean-reversion analysis on volatility spikes after geopolitical shocks. If the situation remains contained, the 10-year Treasury yield would likely re-stabilize near its 4.30% baseline. This scenario is supported by the fact that global central banks, including the Federal Reserve, have historically provided liquidity backstops when geopolitical volatility threatens to tighten financial conditions excessively, according to historical FOMC policy transcripts.
The bear case, by contrast, involves a sustained closure or a widening of the conflict to include regional assets, which would likely push the S&P 500 toward the next major support shelf at 4,950. A prolonged closure would necessitate a significant upward revision in energy inflation expectations, potentially forcing the Federal Reserve to reconsider its current 3.64% rate path, despite the recent CPI print of 3.3%. In this environment, we would anticipate the VIX to sustain levels above 25.0, reflecting a regime shift toward high-beta volatility. The trigger for this downward spiral would be a confirmation of prolonged blockage, which would effectively remove the energy supply cushion that has underpinned industrial output since the start of the year, per EIA projections.
What to Watch Next
- Watch whether the S&P 500 holds the 5,050 support level during the first 60 minutes of the cash session, as a breakdown below this point signals further technical capitulation.
- Key level: The 4.15% yield on the 10-year Treasury, which serves as the critical psychological pivot for interest-rate-sensitive assets.
- If Brent crude sustains a move above $92.50 per barrel, then expect intensified selling pressure on airline and consumer discretionary ETFs, as margins will be squeezed by fuel costs.
- Trigger: Official statements from the U.S. Fifth Fleet or further shipping lane confirmation from Reuters after 11:00 AM ET.
Disclaimer: This briefing is for informational purposes only and does not constitute financial advice, an offer to sell, or a solicitation of an offer to buy any securities. All market data is derived from the sources indicated, including Reuters, the Federal Reserve, and FactSet. Past performance is not indicative of future results; trading in financial markets involves significant risk of loss.
Frequently Asked Questions
Why is the market moving right now?
Markets are reacting to the high-severity news that Iran’s navy has closed the Strait of Hormuz following reports of gunfire at two commercial vessels. This has triggered a 14% spike in the VIX and a shift toward defensive assets as investors price in potential energy supply chain disruptions.
What should investors watch next?
Investors should monitor the 5,050 support level on the S&P 500 and the 4.15% yield on the 10-year Treasury. The primary trigger to watch is any official diplomatic or military confirmation regarding the reopening of the shipping lanes.
How does the closure of the Strait of Hormuz impact global inflation expectations?
Because approximately 20-30% of global oil transit flows through the Strait, any sustained closure threatens to spark energy-driven inflation. With the current CPI at 3.3%, this supply-side shock could force the Federal Reserve to reassess its interest rate policy, complicating the path back to the 2% target.
This analysis is provided for educational and informational purposes only. It is not investment advice. Consult a qualified financial advisor before acting on any information presented here.
💼 Recommended Brokers
Affiliate disclosure: We may receive compensation if you open an account through these links. This does not affect our analysis.


