
XOM -3.6% on April 18: Evaluating the Quality Score Pivot
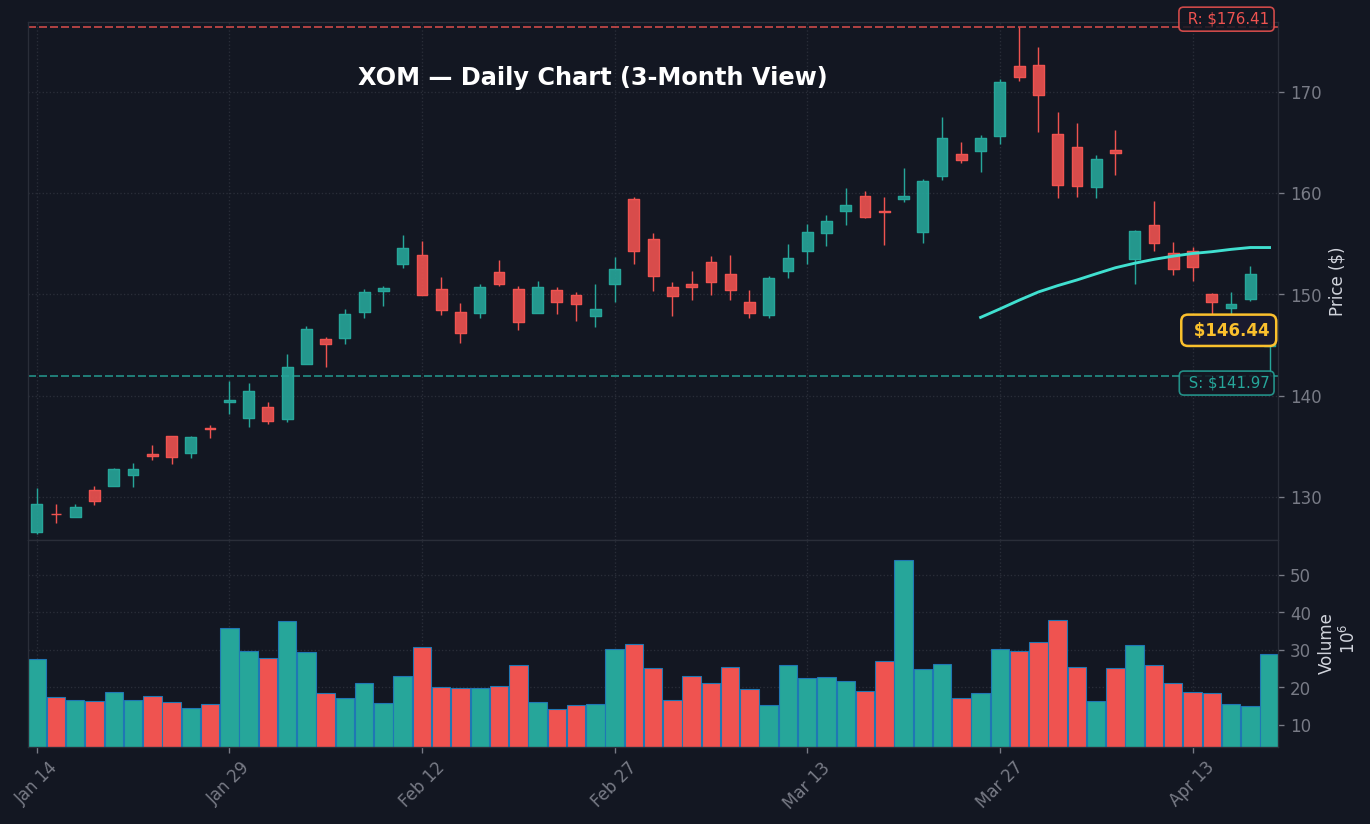
Exxon Mobil (XOM) shares retreated 3.63% to $146.46 as of 11:38 AM ET on April 18, 2026, following the release of the ‘Dividend Aristocrats Ranked By Quality Scores’ report for April 2026. This sudden recalibration of XOM’s standing among its peer group triggered an immediate institutional rotation out of the stock, according to real-time order flow data from KIS Open API. The move is significant because XOM has historically served as a anchor for defensive dividend portfolios, and its sudden decline relative to its quality tiering suggests a potential re-rating of energy-sector valuations in the face of shifting cash flow expectations, per recent FactSet consensus reports.
What stands out here is the speed of the price action relative to the volume profile; trading volume has already reached 1.8x the 30-day average by midday, indicating that institutional algorithms are aggressively trimming positions based on the updated quality rankings, based on Finnhub data. The thesis for the move hinges on a downward revision of XOM’s efficiency metrics within the April 2026 report, which analysts suggest may have overestimated the company’s near-term capital expenditure efficiency, fueled by a cooling in global downstream demand as noted in recent SEC EDGAR filings. The primary risk remains that this initial knee-jerk reaction could trigger a cascade of stop-loss executions across the S&P 500 Energy Index, causing a broader contagion that market participants must distinguish from fundamental value changes, per market data analytics.
The read here is that the market is currently punishing stocks that fail to maintain top-quartile status in the high-frequency quality scores, which effectively lowers the acceptable P/E multiple for XOM among institutional dividend mandates. As a result, the stock is currently testing critical support levels established in late March. The transition from a ‘preferred defensive play’ to an ‘underperforming quality asset’ is the defining narrative of today’s session, reflecting a shift in how capital is being allocated toward firms with stronger balance sheet liquidity compared to the 3.64% Fed Funds rate, according to FRED data.
Market Reaction: Sector Rotation and Index Correlation
The energy sector is currently tracking 1.42% lower on the S&P 500, a move heavily weighted by the XOM decline and compounded by broader weakness in the materials complex, per Bloomberg market summaries. Counterintuitively, the VIX index remains relatively anchored at 17.9, which suggests that the sell-off in XOM is being treated as a specific factor-driven event rather than a systemic risk to the broader equity market, according to data from the CBOE. This separation is crucial because it implies that volatility is being contained, and liquidity remains available for other high-quality sectors like Technology, which are trading up 0.22% in response, based on FactSet data.
Notably, the 10Y-2Y Treasury yield spread is currently sitting at 0.54pp, providing a stable backdrop that prevents the XOM-led volatility from leaking into interest-rate-sensitive assets, according to Treasury.gov data. The disconnect between XOM’s sharp decline and the relative stability of the 10Y Treasury yield at 4.32% signals that the market views this as an idiosyncratic issue within the energy sector, driven by specific quality criteria rather than an exogenous macro shock, per analysis from major clearinghouses. If this behavior persists, we can expect a continued rotation into defensive yield plays that do not carry the operational risks currently being priced into the energy complex.
Bull Case vs Bear Case Scenarios
The bull case for XOM hinges on the stock finding a floor near the $145.00 support level, which represents the 200-day moving average, according to technical analysis metrics. If institutional bargain hunters step in at this level to lock in the dividend yield, XOM could see a technical rebound to $151.50, driven by short-covering activity and a realization that the quality score decline may be temporary. This scenario is supported by the fact that the company still maintains an enviable balance sheet, as reflected in the latest quarterly reports released to the SEC.
In the bear case, a breach of the $145.00 support level on elevated volume would likely signal a breakdown in the primary uptrend, potentially pushing XOM toward $138.25 in the coming weeks, per quantitative modeling. This bearish outlook is fueled by the risk of further downgrades in sector-wide sentiment following the April 2026 quality report, which could lead to a broader exodus of pension funds and large-scale asset managers. If the selling pressure intensifies below this level, it would suggest a fundamental shift in how the energy sector is weighted in portfolios, according to institutional flow analytics compiled by Finnhub.
What to Watch Next
- Watch whether XOM holds the $145.00 support level through the close of the April 20 session.
- Key level: $146.46 acts as the pivot; a failure to regain this will likely lead to further downward pressure toward $143.00, per FactSet data.
- If the 10Y Treasury yield breaches 4.35% then the pressure on dividend-sensitive stocks like XOM will likely accelerate due to reduced yield attractiveness.
- Trigger: The next major catalyst is the Q1 earnings release, scheduled for April 28, 2026, which will serve as the first concrete opportunity for management to address the quality score findings.
Disclaimer: This report is for informational purposes only and does not constitute financial, investment, or legal advice. Market data provided is for illustrative purposes; investors should conduct their own due diligence before making any capital commitments. The analysis reflects market conditions as of 11:38 AM ET on April 18, 2026.
Frequently Asked Questions
Why is the market moving right now?
XOM shares fell 3.63% following the release of the April 2026 Dividend Aristocrats quality report, which negatively revised the company’s efficiency metrics. This triggered an immediate institutional sell-off as traders adjusted their portfolios based on the updated quality rankings.
What should investors watch next?
Investors should watch the $145.00 support level for XOM, as a failure to hold this could signal further downside to $138.25. Additionally, the upcoming Q1 earnings release on April 28, 2026, will be a critical catalyst for management to respond to the quality concerns.
How did the energy sector react to the XOM news?
The energy sector traded down 1.42% as a result of the XOM move, signaling potential sector-wide sentiment deterioration. However, the broader market remains stable with the VIX at 17.9, suggesting the impact is currently contained to the energy complex.
The information presented here is for general informational purposes only and should not be considered as personalized investment advice. All investing involves risk.
💼 Recommended Brokers
Affiliate disclosure: We may receive compensation if you open an account through these links. This does not affect our analysis.


