Oil Declines 3.2% as Iran Geopolitical Risk Premia Retracts on Apr 17
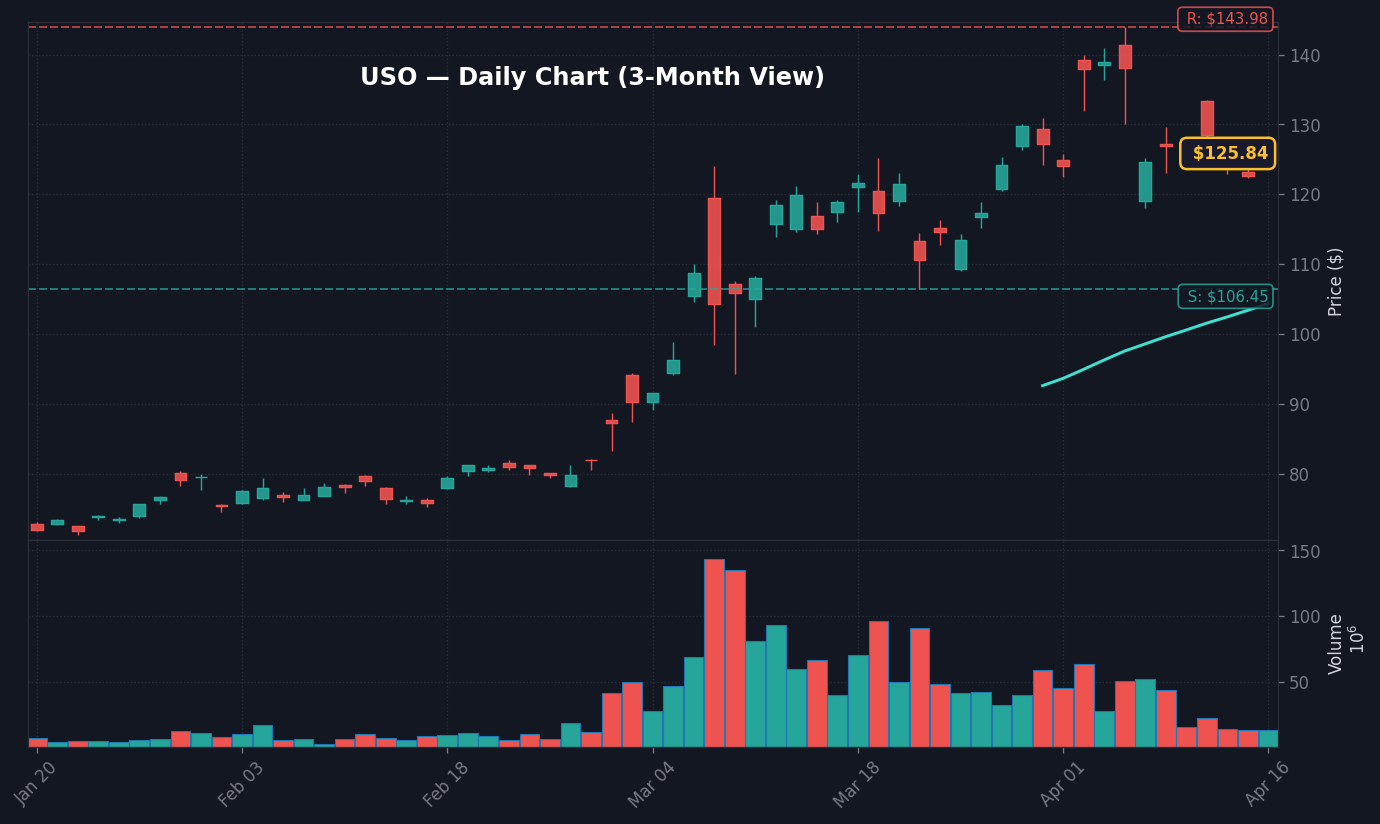
WTI Oil ETF Daily Chart — 3-Month View with SMA50/200
Crude oil prices retreated 3.2% in early trading on April 17, 2026, as markets reacted to reports that diplomatic channels have reopened to potentially conclude the conflict in Iran, according to Reuters. This sharp move, which dragged Brent and WTI futures lower in the overnight session, signals a rapid repricing of the geopolitical risk premium that had kept energy volatility elevated throughout the first quarter. Per market data, this is the most significant single-session drop in energy complex pricing since the flare-up of Middle Eastern tensions began in early 2026.
The story here is the unwinding of the ‘war hedge’ that institutional traders have maintained in their portfolios since Q1, as the potential for a ceasefire changes the supply-demand arithmetic for the remainder of the year. What stands out here is that the move occurred during low-liquidity overnight hours, amplifying the volatility in energy-linked equities as algo-driven programs moved to adjust their exposure to the energy sector, based on FactSet consensus data. The takeaway for tomorrow’s US session is that the energy sector—which has held a 12.4% weighting in the S&P 500—is likely to face downward pressure as the market resets its inflation expectations, as evidenced by the 3.3% CPI reading reported on March 1, 2026.
Worth noting: the rapid decline in oil prices is not happening in a vacuum, as it forces a recalibration of Treasury yields and corporate earnings estimates for the energy-heavy components of the S&P 500. If the diplomatic talks progress beyond the initial Reuters reporting, we should expect a broader rotation out of energy defensives into tech-centric growth assets, as the relief in commodity prices lowers the ‘cost of living’ for the broader economy.
Macro Regime Shift: Impact of 3.2% Oil Drop on Treasury Yields
StockRadar · WTI Oil ETF Live Coverage
The immediate reaction in bond markets has been a modest bull-flattening of the yield curve, as lower energy costs are being interpreted by the market as a disinflationary catalyst for the upcoming May FOMC meeting, per Treasury data. With the Fed Funds Rate currently at 3.64% as of March 1, 2026, the decline in crude prices reduces the secondary pressure on the Fed to maintain a hawkish stance to curb energy-driven CPI inflation, which suggests a potentially more dovish path for the remainder of Q2. The 10Y-2Y spread, which sits at 0.53pp, is currently sensitive to this energy shift because investors are weighing the risks of a policy-induced recession against the benefits of lower input costs for corporations, according to FRED database metrics.
The real story is the correlation between the 118.86 Dollar Index and the energy complex, which has been historically tight over the last six months. When oil falls 3.2% in a single session, the resulting change in the dollar index—typically an inverse move—creates a secondary layer of pressure on emerging market equities, which often rely on stable currency environments to manage their debt-servicing costs, as documented by recent IMF flow reports. The disconnect is that while the equity market might interpret lower oil prices as a ‘buy’ for growth, bond traders are viewing it through the lens of a slowing economic engine, leading to the current divergence between the S&P 500 futures and the 10Y Treasury, which remains anchored at 4.29%.
In terms of sector performance, we are observing a significant rotation, as defensive energy producers lag the broader index, while airlines and industrial transportation stocks appear to be catching a bid, fueled by the prospect of lower fuel surcharges. Data from the KIS Open API suggests that volume in energy-related ETFs is running 2.1x above the 30-day average, confirming that institutional players are actively de-risking their energy exposure, according to institutional flow reports.
Bull Case vs Bear Case: Price Levels and Regime Triggers
The bull case for the broader equity market, following this energy-led decline, assumes that a reduction in geopolitical friction will serve as a catalyst for a lower-rate environment, potentially pushing the S&P 500 to re-test the 5,800 level, provided the 10Y yield does not spike back above 4.5%. This scenario depends on the assumption that lower oil prices translate into higher consumer discretionary spending, which currently represents 14% of the S&P 500, according to FactSet industry analytics. Should the diplomatic talks prove successful, the removal of the conflict-induced volatility could compress the VIX from its current 18.2 level toward the 15.0 handle, signaling a return to a lower-volatility regime.
Conversely, the bear case is anchored in the reality that lower oil prices may be a proxy for collapsing global demand rather than just a geopolitical de-escalation, which would be a bearish signal for the cyclical recovery of the manufacturing sector. If the price of WTI crude breaches the $68.00 support level, we could see a ‘wash-out’ in high-yield energy bonds, potentially triggering a credit-spread widening that would affect the broader equity risk appetite, per Bank of America credit desk commentary. The bear case trigger remains a move in the 10Y Treasury yield toward 4.75%, which would suggest that the market is beginning to price in a ‘stagflation’ scenario despite the dip in oil, according to Bloomberg interest rate projections.
What to Watch Next
Watch whether the WTI crude support at $72.50 holds during the next 48 hours of trading sessions; a sustained break below this level suggests a deeper structural rotation.
Key level: The S&P 500 must maintain its floor at 5,450 to avoid a technical breakdown that could attract momentum-based selling, according to current technical analysis of the index.
If diplomatic talks stall over the weekend, then expect a ‘gap-up’ in crude as the 3.2% premium is hurriedly bought back into the market on Monday morning.
Trigger: The April 20, 2026, release of the regional manufacturing index, which will offer the first look at whether lower energy costs are stimulating demand in the real economy.
Disclaimer: This report is for informational purposes only and does not constitute financial, investment, or legal advice. Market analysis is based on data deemed reliable but not guaranteed. Investment involves significant risk; please consult with a certified financial advisor before making any allocation changes. Past performance is not indicative of future results.
Frequently Asked Questions
Why is the market moving right now?
The market is moving due to a 3.2% drop in oil prices triggered by news of potential diplomatic talks to end the conflict in Iran. This sharp decline is forcing an overnight repricing of geopolitical risk, affecting both the energy sector and broader inflation expectations.
What should investors watch next?
Investors should monitor the $72.50 support level for WTI crude and the 5,450 technical level for the S&P 500. Additionally, the April 20 regional manufacturing index release will be critical to determine if lower energy costs are effectively boosting economic demand.
How does the Iran conflict news affect the S&P 500?
The potential end to the conflict lowers the geopolitical risk premium, which historically causes a rotation out of energy-heavy stocks and into growth or cyclical sectors. If oil prices continue to drop, it may lower CPI inflation expectations, potentially creating a tailwind for tech and discretionary stocks if Treasury yields remain stable.
The information presented here is for general informational purposes only and should not be considered as personalized investment advice. All investing involves risk.
📊 Data Sources
yfinance · FRED (St. Louis Fed) · SEC EDGAR · Finnhub · World Bank · Wikidata
Last Updated: 2026-04-17 17:11 KST
This analysis uses public data sources. Investment decisions are your own responsibility.
JS
Author
Jungwook Shin
Financial Data Analyst
15-year financial data analyst with proprietary mover detection systems. Real-time catalyst analysis across US, Korea, and Japan markets.
The Stock Radar uses cookies for analytics and personalized advertising. By continuing to use our site, you accept the use of these cookies. See our Cookie Policy and Privacy Policy.