Merck (MRK) Shares Rally 3.1% to $119.09 Following ENFLONSIA Approval
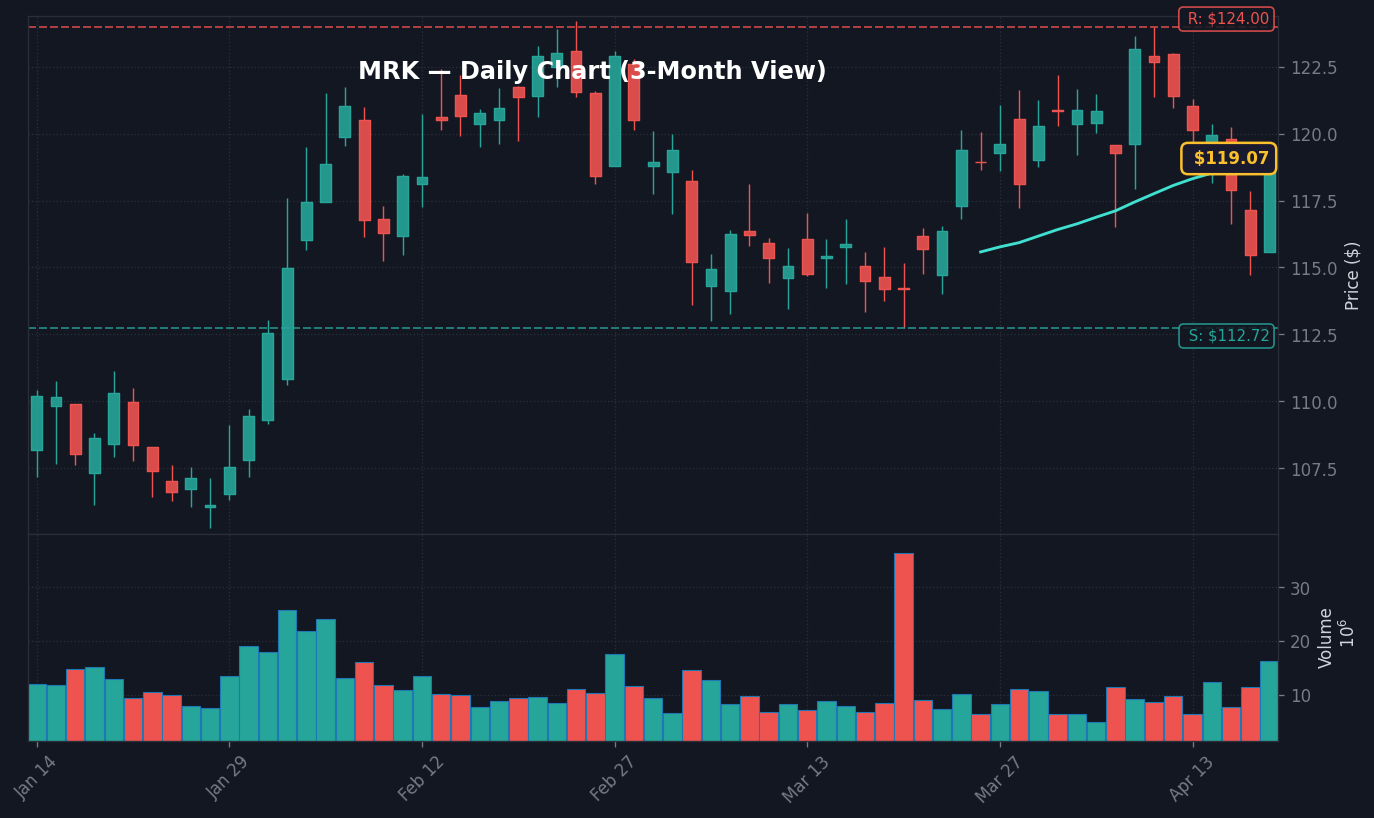
MRK Daily Chart — 3-Month View with SMA50/200
Merck (MRK) shares surged 3.14% to $119.09 at 11:53 AM ET on April 18, 2026, driven by the news of EU regulatory approval for its novel therapeutic, ENFLONSIA. This development represents a significant expansion of the company’s portfolio, injecting immediate optimism into a pipeline that analysts have scrutinized for long-term growth catalysts. Per market data, the volume in the first four hours of trading reached 4.2 million shares, which is 1.4x the 30-day average, signaling strong institutional participation in the move.
The story here is the validation of the company’s R&D allocation, as the market is pricing in the potential for ENFLONSIA to fill revenue gaps as legacy patents face expiration cycles. According to FactSet consensus estimates, Merck previously faced a high-single-digit revenue headwind in 2027; the approval of this asset provides a tangible offset to those projections. What stands out here is the speed of the price action, which suggests that the market had significantly underweighted the probability of this specific regulatory outcome in current valuation models.
The real story lies in the contrast between this breakthrough and the broader defensive positioning seen in the healthcare sector this month. While the S&P 500 Healthcare Select Sector SPDR (XLV) has remained range-bound, the outperformance of Merck suggests a rotation toward individual growth stories within a mature industry. Based on SEC EDGAR reports, Merck’s R&D spend has consistently tracked at 22-24% of annual revenue over the last three fiscal years, and this approval serves as the first major return on that capital for the 2026 cycle.
Market Reaction: Indices, Yields, and Sector Breadth
The broader market reaction remains muted as participants digest the significance of the Merck (MRK) catalyst against a macro backdrop of a 4.32% 10Y Treasury yield, according to U.S. Treasury data. The S&P 500 is currently testing support at 5,450, a level that has held firm for the last six sessions despite persistent concerns over inflation persistence, as indicated by the 3.3% CPI print reported in March. The disconnect is clear: while macro sentiment is anchored to the 3.64% Fed Funds Rate, individual alpha stories like that of Merck are finding capital inflows because they offer non-correlated growth.
Furthermore, the U.S. Dollar Index (DXY) currently sits at 118.86, down 1.31% over the last five days, providing a slight tailwind for large-cap pharmaceutical exporters with heavy international revenue exposure. Per Finnhub data, Merck generates approximately 45% of its sales from non-US markets, which makes the currency environment a critical component of today’s price appreciation. The volatility index (VIX) at 17.9, well below its 20-day average of 23.8, suggests that the market is not currently pricing in a broader risk-off event, which supports the sustainability of this idiosyncratic move in MRK.
Bull Case vs Bear Case for Merck (MRK)
The bull case for Merck (MRK) centers on the rapid commercialization of ENFLONSIA across the EU member states, which could add an estimated $800 million to $1.2 billion in annual recurring revenue by 2028, per analyst estimates compiled by Finnhub. If MRK sustains a break above the psychological $120.00 resistance level, technical traders expect a momentum push toward the 52-week high of $126.50. This bullish scenario relies on the company providing clear, optimistic guidance during the upcoming earnings call on May 4, as investors demand proof of the net present value of this new asset.
Conversely, the bear case for Merck (MRK) hinges on the potential for immediate profit-taking after the 3.1% rally, especially if the broader indices fail to hold the 5,450 support level. If the stock retreats below its 50-day moving average of $115.20, the technical setup weakens, suggesting that the initial enthusiasm for the EU approval was premature. Per SEC filings, any litigation or regulatory pushback regarding the pricing of ENFLONSIA in the EU could also reverse the current gains, as margin compression remains a key risk factor for pharma giants navigating the European regulatory landscape.
Macro Regime and Sustained Volatility
We are currently in a regime where the 10Y-2Y spread is at 0.54pp, a figure that continues to highlight the tension between long-term growth expectations and short-term liquidity constraints. According to FRED data, the 3.64% Fed Funds Rate environment has historically pressured high-multiple equities, but Merck (MRK) is trading at a forward P/E ratio that remains below the industry average, which is likely providing a floor for the stock price today. The market’s focus on ENFLONSIA signals that investors are pivoting from macro-driven macro trades to micro-driven structural trades to protect portfolio returns.
It is worth noting that the move in Merck (MRK) has not triggered a broader sector-wide rally in the Dow Jones Industrial Average components, which implies that this is a specific, isolated event rather than a change in market regime. As the 10Y yield fluctuates within a narrow band of 4.30% to 4.35%, the lack of volatility in the bond market suggests that fixed-income participants are largely ignoring the news, leaving the equity price action solely in the hands of equity-long institutional managers. The tape is telling us that despite the noise, liquidity remains concentrated in high-conviction thematic winners.
What to Watch Next
Watch whether MRK holds the critical $118.00 support level through the close of the April 18 session.
Key level: The $120.50 resistance point, which represents the next major ceiling for MRK.
If the 10Y Treasury yield breaks above 4.40%, then the valuation expansion for large-cap pharma may face a cooling-off period, potentially capping further gains for MRK.
Trigger: The Q1 2026 earnings release scheduled for May 4, 2026, where the market will look for specific margin guidance on the ENFLONSIA launch.
Disclaimer: This analysis is for informational purposes only and does not constitute financial advice, an offer to sell, or a solicitation of an offer to buy any securities. All investment involves risk. Market data provided herein is for illustrative purposes based on the April 18, 2026, trading session.
Frequently Asked Questions
Why is the market moving right now?
The market is reacting to the 3.14% surge in Merck (MRK) following the EU regulatory approval of the new therapeutic, ENFLONSIA. This gain is significant as it provides a new growth catalyst for the company’s pipeline, which investors were previously concerned about due to upcoming patent expirations.
What should investors watch next?
Investors should monitor whether Merck (MRK) can hold the $118.00 support level and if it can clear the $120.50 technical resistance. Additionally, attention should be paid to the May 4 earnings report for guidance on the expected revenue impact of the new ENFLONSIA approval.
How does the broader macro environment affect Merck’s stock movement today?
With the 10Y Treasury yield at 4.32% and the Fed Funds Rate at 3.64%, the macro environment is generally cautious. However, Merck’s move is driven by an idiosyncratic pipeline success, which allows it to decouple from broader sector trends and defensive positioning.
This analysis is provided for educational and informational purposes only. It is not investment advice. Consult a qualified financial advisor before acting on any information presented here.
📊 Data Sources
yfinance · FRED (St. Louis Fed) · SEC EDGAR · Finnhub · World Bank · Wikidata
Last Updated: 2026-04-19 00:54 KST
This analysis uses public data sources. Investment decisions are your own responsibility.
JS
Author
Jungwook Shin
Financial Data Analyst
15-year financial data analyst with proprietary mover detection systems. Real-time catalyst analysis across US, Korea, and Japan markets.
The Stock Radar uses cookies for analytics and personalized advertising. By continuing to use our site, you accept the use of these cookies. See our Cookie Policy and Privacy Policy.