7420.31 is the first line that matters at 10:22 AM ET: the S&P 500 is down 1.05%, the Nasdaq Composite is off 1.97%, and the VIX is up 14.36% to 19.03, per Market Data.
The immediate market consequence is clear even though the supplied breaking-event feed does not identify a named catalyst: traders are selling growth exposure first, with Consumer Discretionary down 4.31%, Communication Services down 2.78%, and Nasdaq futures down 1.57%, per Market Data. That is the first-order message of this market alert.
The key risk is that the opening move gets mistaken for the full message before confirmation arrives. The S&P 500 is trading below its 50-day SMA at 7472.02, while RSI sits at 44.73 and MACD is below its signal line, per the supplied technical data; that makes 7472.02 the nearest actionable level because reclaiming it would challenge the risk-off tape, while failure below it keeps sellers in control.
How Did VIX 19.03 and 10Y 4.71% Change the Message?
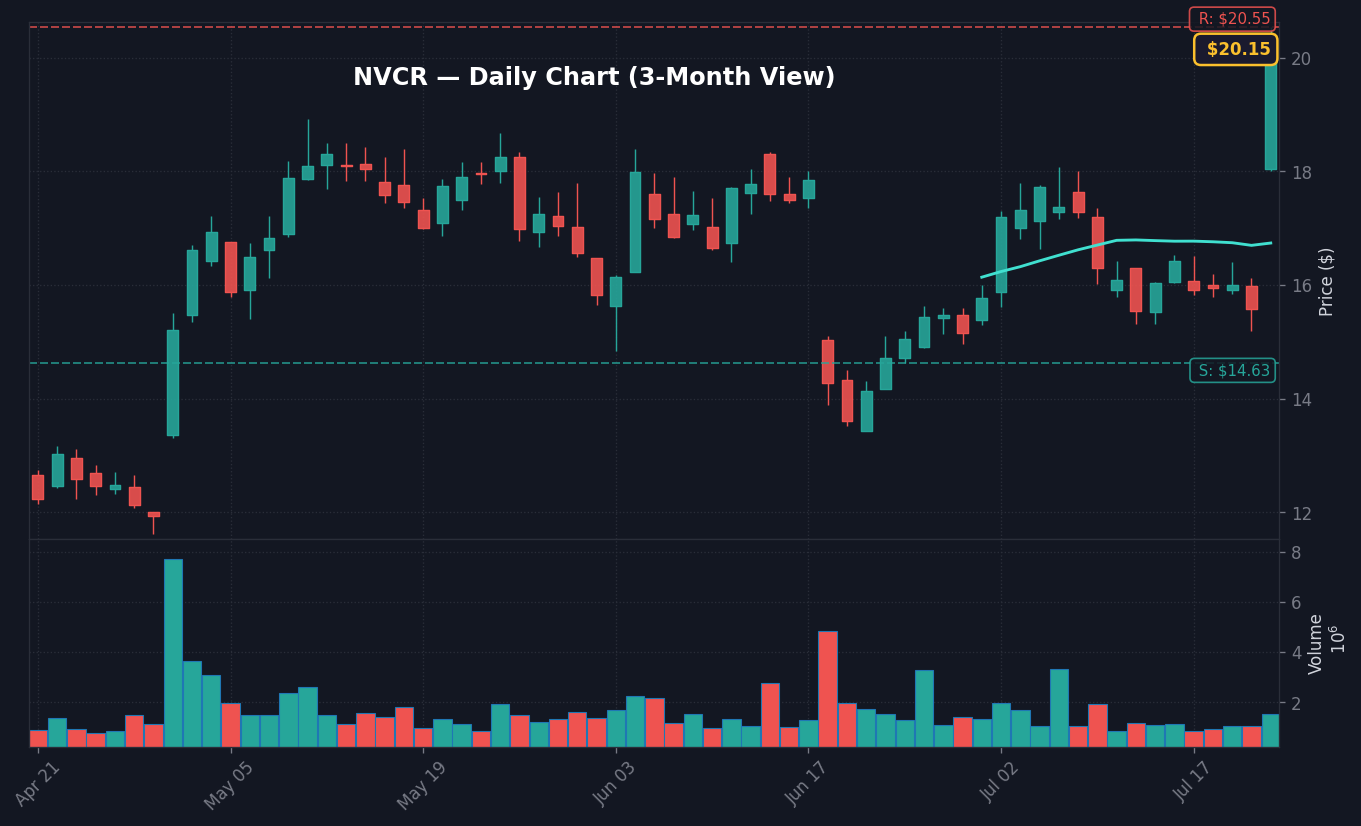
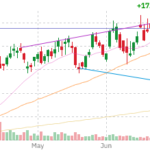
NVCR Daily Chart — 3-month view with SMA50/200
VIX at 19.03, up 14.36%, says the market is paying for near-term protection, while the 10-year Treasury yield at 4.71%, up 1.16%, says bonds are not delivering the usual equity shock absorber, per Market Data. That combination is important because it turns a stock selloff into a cross-asset tightening signal.
The cross-asset bridge is the 10Y-2Y spread at 0.37 percentage point, with the 10-year at 4.63% and the 2-year at 4.26% in the FRED snapshot. A positively sloped curve alongside sticky CPI at 3.7% does not scream recession hedge; it points to a market that still has to price duration risk while equities are already under pressure.
Worth noting: the VIX move is large in percentage terms but not yet a panic level versus the 20-day average of 16.8 in the FRED snapshot. A move from 16.6 to 19.03 is enough to tighten dealer hedging and pressure intraday liquidity, but it is not yet the kind of volatility event that usually forces wholesale capitulation.
The Dollar Index at 120.53, down 0.17% over five days, per FRED data, also keeps this from being a classic dollar-squeeze shock. If the dollar were ripping at the same time as yields and VIX, the stress message would be cleaner. Instead, the pressure is more equity-duration specific, with confirmation still needed from rates, credit, and closing breadth.
TSLA -12.86%, GOOG -7.09%: Where the Damage Is Concentrated
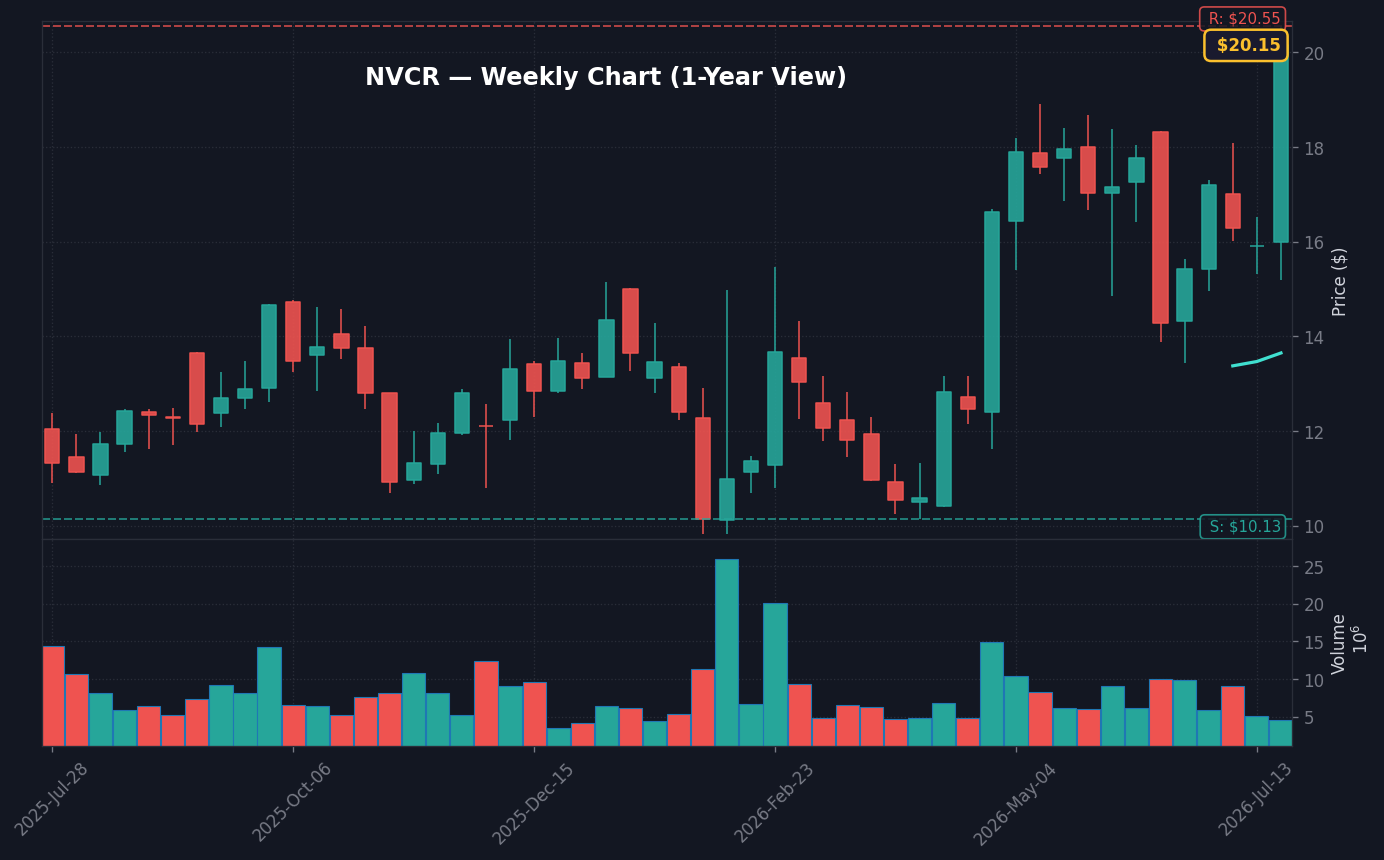
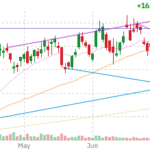
NVCR Weekly Chart — 1-year view with SMA50/200
TSLA is down 12.86%, GOOG is down 7.09%, GOOGL is down 6.88%, AMZN is down 4.29%, and NVDA is down 1.79%, per Market Data. The leadership map says the selloff is hitting megacap growth and consumer-duration risk harder than old-economy cyclicals.
Consumer Discretionary’s 4.31% sector drop is the largest sector decline in the supplied data, per Market Data. That aligns with TSLA’s 12.86% decline, AAL’s 7.88% drop, and ALGT’s 6.27% decline. When the consumer-beta bucket leads lower while the 10-year yield is 4.71%, the market is effectively asking whether discretionary demand can absorb tighter financial conditions.
Communication Services is the second-worst sector, down 2.78%, per Market Data. The pressure in GOOG and GOOGL matters because mega-cap communication names often behave like hybrid duration assets: part advertising cycle, part AI capex debate, part multiple sensitivity. A 7% move in that group is enough to drag index-level performance even if defensive sectors hold up.
The overlooked read-through is that NVDA down 1.79%, AMD down 0.31%, AVGO down 0.51%, and TSM down 0.47% do not show the same forced liquidation visible in TSLA and GOOG, per Market Data. That does not make semis safe, but it says the market is discriminating. The immediate pain is in exposed megacap and consumer-beta pockets, not every AI-linked balance sheet.
On the other side, Industrials are up 2.16%, helped by URI up 12.06%, LMT up 11.21%, RTX up 8.13%, HON up 6.02%, and NSC up 7.26%, per Market Data. That is a judgment point: this is not a market abandoning cyclicality altogether. It is rewarding earnings visibility and punishing duration where valuation was doing too much work.
Why 7472.02 Is the S&P 500 Level That Matters
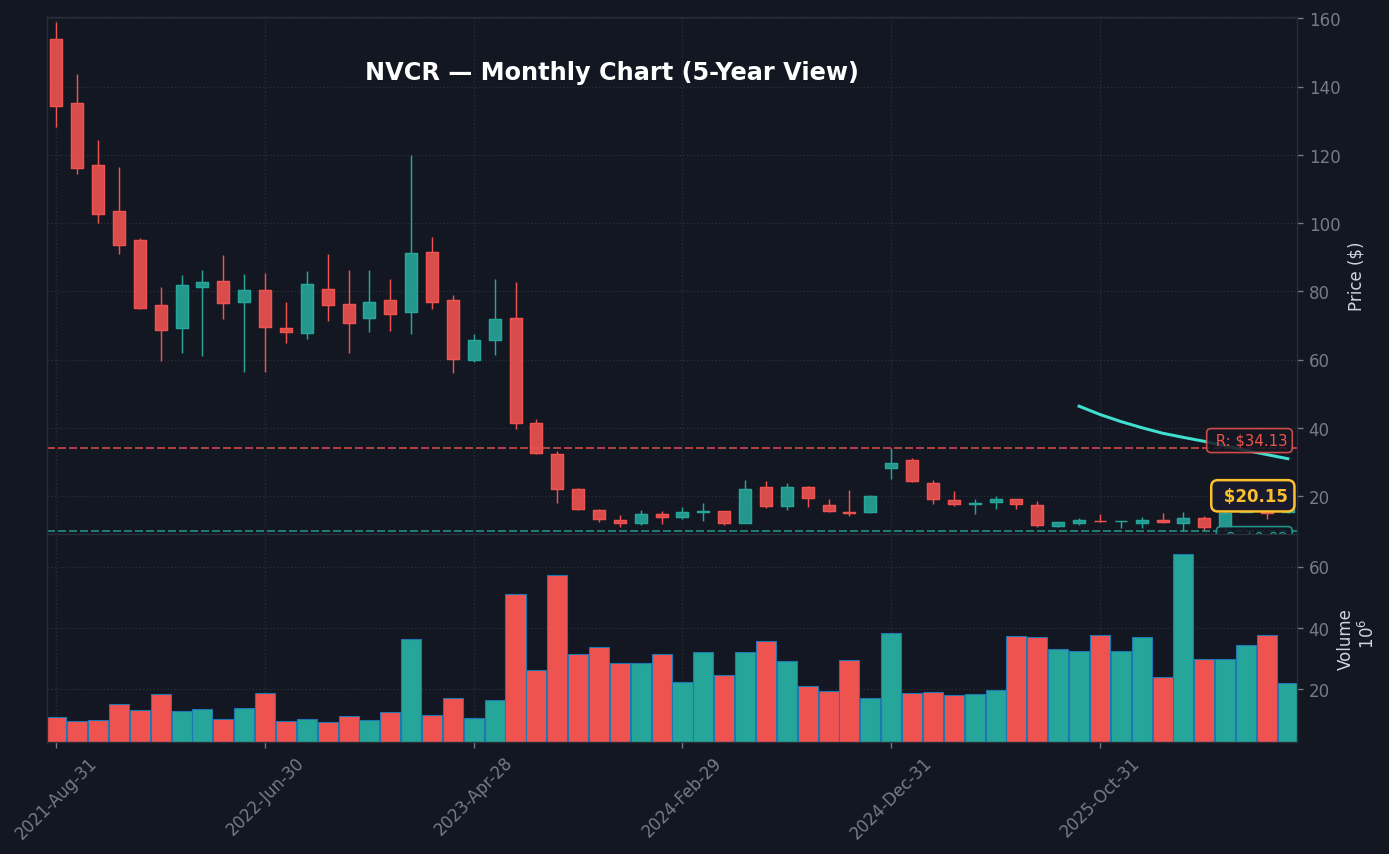
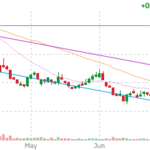
NVCR Monthly Chart — 5-year view with SMA50/200
The S&P 500 is at 7420.31 versus its 50-day SMA at 7472.02, per the supplied technical data. That 51.71-point gap is the nearest tactical test because a reclaim of 7472.02 would put the index back above a widely tracked trend line, while rejection below it confirms that sellers have converted the 50-day average into resistance.
The RSI at 44.73 is neutral, not washed out, per the supplied technical indicators. That matters because a 1.05% index drop with RSI still above oversold territory leaves room for more selling if liquidity thins or if the unnamed catalyst behind the market alert gets confirmed by a second headline.
MACD at 9.1624 versus a signal line of 19.867 also leans cautious, per the supplied technical data. There is no MACD crossover listed, so the chart is not flashing a fresh technical breakdown by that measure. But the spread between MACD and signal says momentum has already softened before this 10:22 AM ET alert.
Counterintuitively, the bull case does not require every growth stock to bounce immediately. The stronger signal would be the S&P 500 reclaiming 7472.02 while VIX fades back toward its 20-day average of 16.8 and Nasdaq losses narrow from the current 1.97% decline, using the supplied Market Data and FRED snapshot. That would show the market absorbing the shock rather than merely staging a short squeeze.
3 Scenarios From Here
Bull: S&P 500 reclaims 7472.02 and VIX falls back toward 16.8 → index stabilizes above the 50-day SMA into the next confirmation window.
Base: S&P 500 stays between 7420.31 and 7472.02 → choppy risk-off rotation persists while traders wait for a named catalyst.
Bear: S&P 500 fails at 7472.02 while Nasdaq remains down near 1.97% → sellers press the current 7420.31 area and volatility stays bid above 19.03.
What the Tape Is Not Pricing Yet at 10:22 AM ET
What the tape is not pricing yet is a clean macro rescue. With CPI at 3.7% year over year and the Fed Funds Rate at 3.63%, per FRED data, the sticky-inflation backdrop limits how aggressively traders can assume rate cuts will offset equity weakness.
That is the difference between a normal pullback and a higher-quality risk alert. If yields were falling hard, the market could frame the selloff as growth fear that eventually helps long-duration equities. But the current 10-year yield is 4.71%, per Market Data, so the discount-rate channel is still working against the most expensive parts of the market.
Consensus often treats a VIX jump as the event. Here, the VIX move is the symptom. The actual message is the combination of VIX up 14.36%, Nasdaq down 1.97%, Consumer Discretionary down 4.31%, and the S&P 500 below 7472.02, all per the supplied Market Data and technical data. That package says the market is marking down risk appetite before it has a clean public catalyst.
The disconnect is that sector leadership is not confirming a recession scare. Energy up 1.81%, Industrials up 2.16%, Healthcare up 0.56%, and Real Estate up 0.40% show selective buying underneath the index drawdown, per Market Data. If this were a full macro growth scare, Energy and Industrials would usually have a harder time leading.
For active traders, that makes confirmation more important than the first print. The highest-quality bearish confirmation would be a failure at 7472.02, VIX holding above 19.03, and spread widening from megacap losers into Industrials and Energy. The highest-quality bullish confirmation would be the opposite: S&P 500 above 7472.02, VIX below 19.03, and Nasdaq narrowing its 1.97% loss.
What to Watch: S&P 500 7472.02 Reclaim
Watch whether the S&P 500 can move from 7420.31 back above its 50-day SMA at 7472.02.
Key level: 7472.02, the S&P 500 50-day SMA from the supplied technical indicators.
If VIX stays above 19.03 and Nasdaq remains down near 1.97% then the market alert keeps pressure on growth and consumer-beta exposure.
Trigger: Next confirmation is the first named follow-up catalyst after the 10:22 AM ET July 23 market alert; the supplied feed does not identify a specific scheduled release.
Next Session Watchpoints
Volume profile: Watch whether NVCR keeps at least 1.5x average.
Key level to watch: Use today’s nearest actionable S&P 500 level from the supplied technicals and explain why it matters. is the pivot for continuation.
Catalyst quality: The move needs follow-through headlines or clean price acceptance above the pivot.
Risk trigger: If NVCR loses the opening range quickly, the move shifts from continuation to fade risk.
Frequently Asked Questions
Why did the S&P 500 fall on July 23?
The supplied breaking-event feed does not identify a named catalyst, but Market Data shows the S&P 500 down 1.05% to 7420.31 at 10:22 AM ET. The Nasdaq Composite fell 1.97% and VIX rose 14.36% to 19.03, pointing to a risk-off move led by growth exposure.
What is the key S&P 500 level after the July 23 market alert?
The key level is 7472.02, the S&P 500 50-day SMA from the supplied technical data. The index is trading at 7420.31, so reclaiming 7472.02 would weaken the bearish signal, while staying below it keeps sellers in control.
Which sectors are moving most during the July 23 selloff?
Consumer Discretionary is the weakest sector at -4.31%, followed by Communication Services at -2.78%, per Market Data. Industrials are up 2.16% and Energy is up 1.81%, which shows rotation rather than a full-market liquidation.
This article is for informational purposes only and does not constitute financial advice. Always do your own research before making investment decisions.