The S&P 500 closed 1.13% lower at 7,448.8 on July 17 as the VIX spiked 11.36% to 18.63, according to Market Data. Simultaneously, the 10-year Treasury yield slipped 0.61% to 4.54%, signaling that this move represents targeted risk reduction rather than systemic panic. Growth-heavy equity sleeves absorbed the brunt of the selling, while yields eased, reflecting a specific shift in market sentiment.
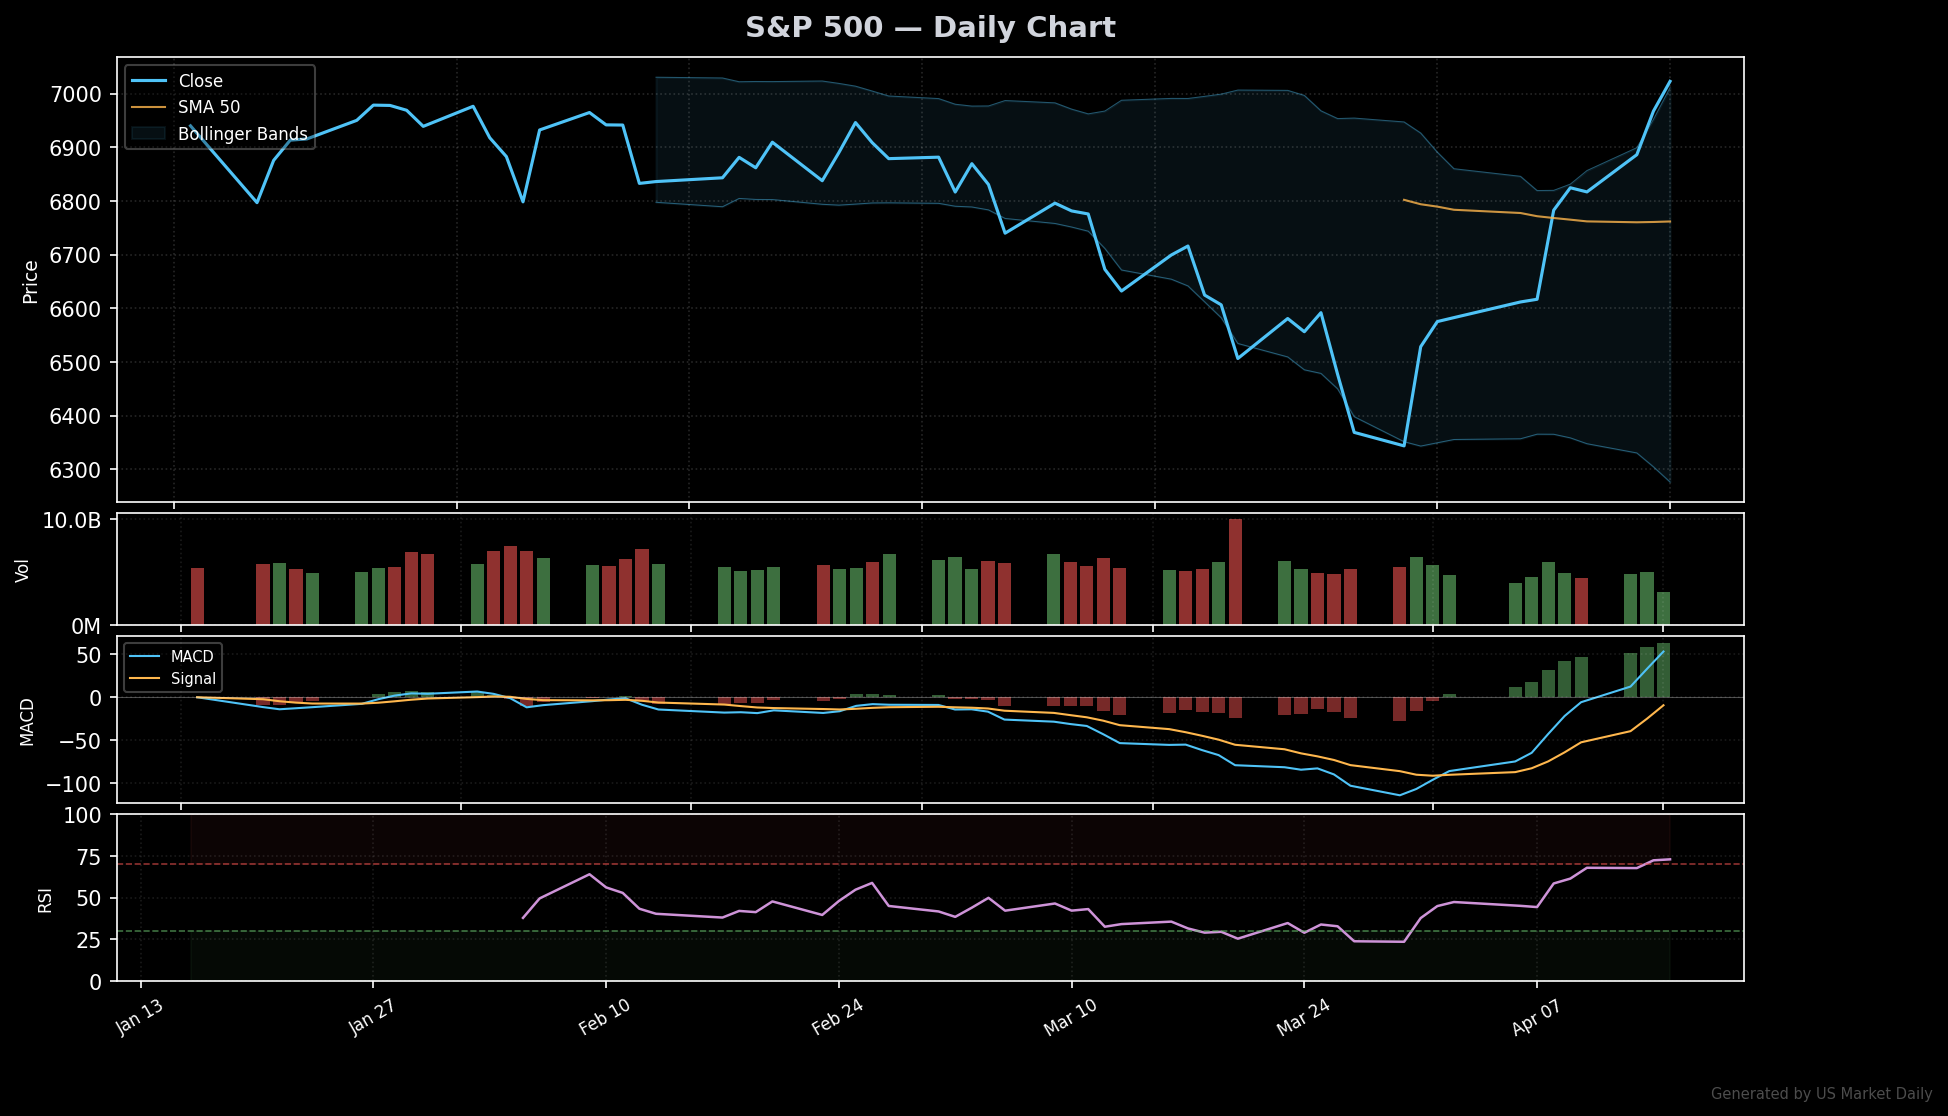
What stands out is the high-priority market alert that triggered the intraday volatility. Traders are currently processing price action and sector breadth without a confirmed headline catalyst. The real story is that initial selling followed a systematic, hedge-driven pattern rather than a fundamental repricing. The S&P 500 currently sits below its 50-day SMA of 7,464.69, while the MACD crossover turns bearish and RSI(14) holds neutral at 57.8, according to Market Data. This signal confirms the tape has weakened without yet reaching a washed-out momentum state.
Why Did VIX Jump 11.36% on July 17?
VIX climbed to 18.63 because the market alert triggered rapid downside hedging. The S&P 500 fell 1.13%, the Nasdaq Composite lost 1.56%, and Nasdaq 100 futures declined 1.59%, per Market Data. While this move is significant intraday, the VIX remains only modestly above its 20-day average of 16.9 from the FRED macro snapshot.
What’s notable here is the shape of the cross-asset response. A standard inflation shock would pressure bonds and equities in tandem; instead, the 10-year Treasury yield is down 0.61% to 4.54%, while the Dollar Index last traded at 120.50, per FRED data. This pattern indicates an equity-risk shock where cyclical confidence is trimmed and hedges are prioritized. The tape shows that investors are paying for protection, yet the bond market is not confirming a runaway macro break.
What Changed at 03:26 PM ET?
At 03:26 PM ET, the confirmed data show a broad equity drawdown: S&P 500 at 7,448.8 (-1.13%), Nasdaq Composite at 25,478.85 (-1.56%), and Dow Jones at 52,132.82 (-0.80%), per Market Data. When the tape moves before event details are confirmed, the market prices liquidity first. Consequently, the first wave of selling is driven by systematic algorithms rather than fundamental investors.
Equity damage is concentrated: Communication Services is down 1.90%, Consumer Discretionary is down 1.61%, and Technology is down 1.30%, while Energy is up 0.91%, per Market Data. Counterintuitively, the 10-year yield decline fails to rescue Technology leaders. NVDA is down 2.55%, AMD is down 1.61%, and CDNS is down 10.24%, confirming that positioning and earnings-risk compression are currently outweighing discount rate benefits.
How Are Bonds, Dollar, and Volatility Framing the Selloff?
The cross-asset frame remains defensive: 10-year Treasury yield at 4.54%, 2-year Treasury yield at 4.13%, and a 10Y-2Y spread of 0.42pp, per FRED and Market Data. The positive 10Y-2Y spread alongside falling long-term yields suggests the market is not simply repricing inflation; it is rotating toward safety. The overlooked signal is the gap between volatility and rates. VIX is up double digits while yields fall, signaling that equity investors are reducing exposure into uncertainty before bond investors force a valuation shock.
Which Sectors Are Paying for the July 17 Alert?
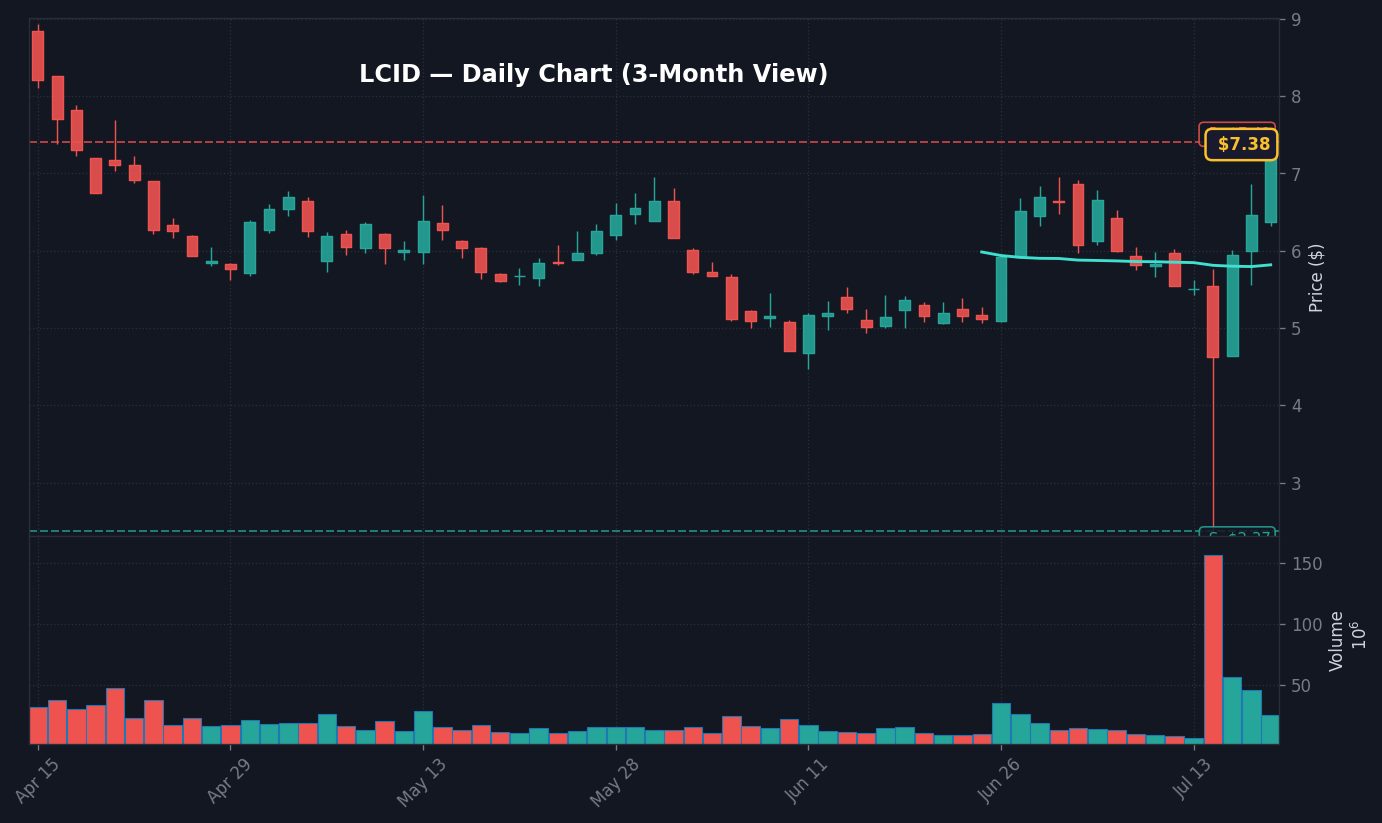
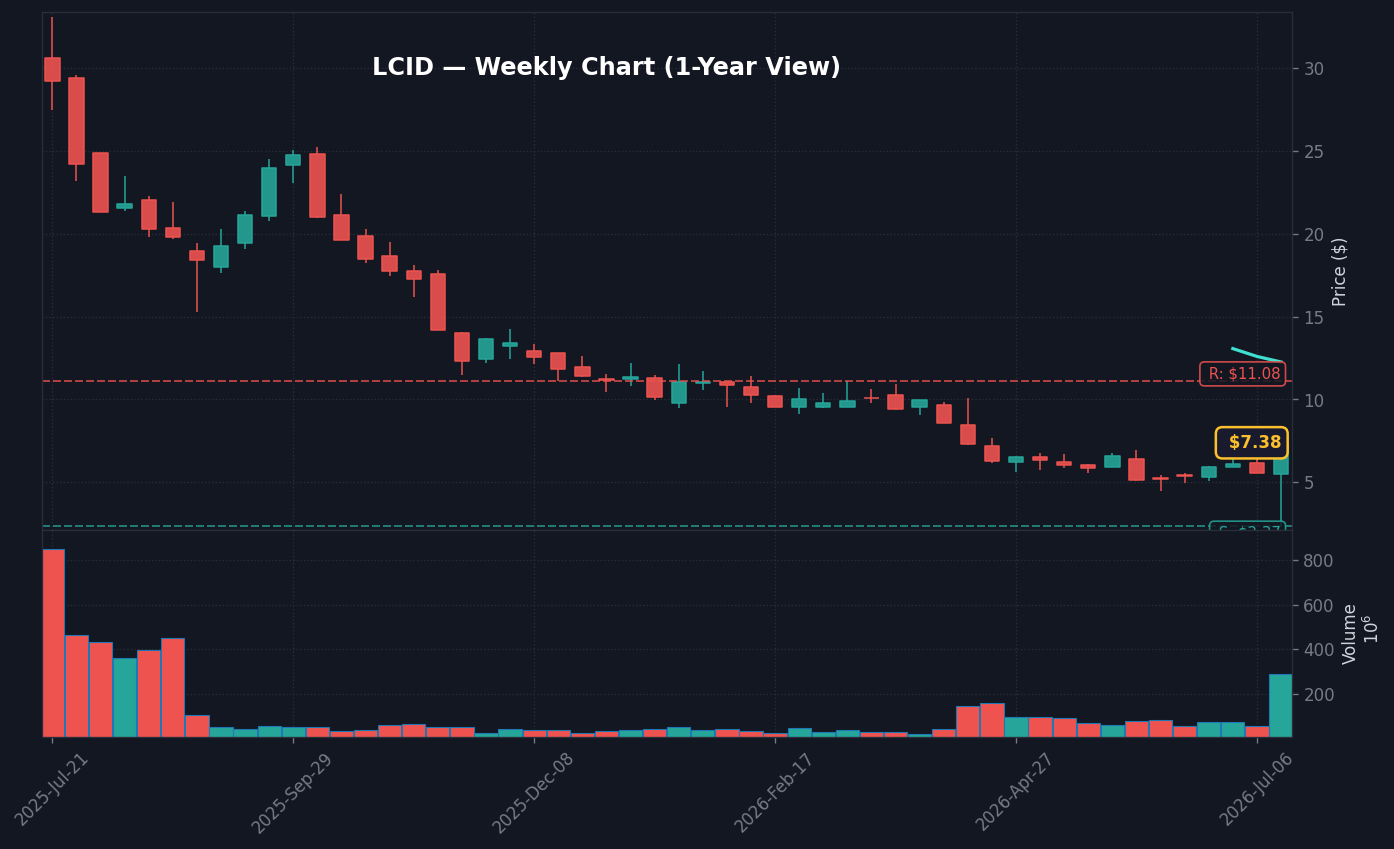
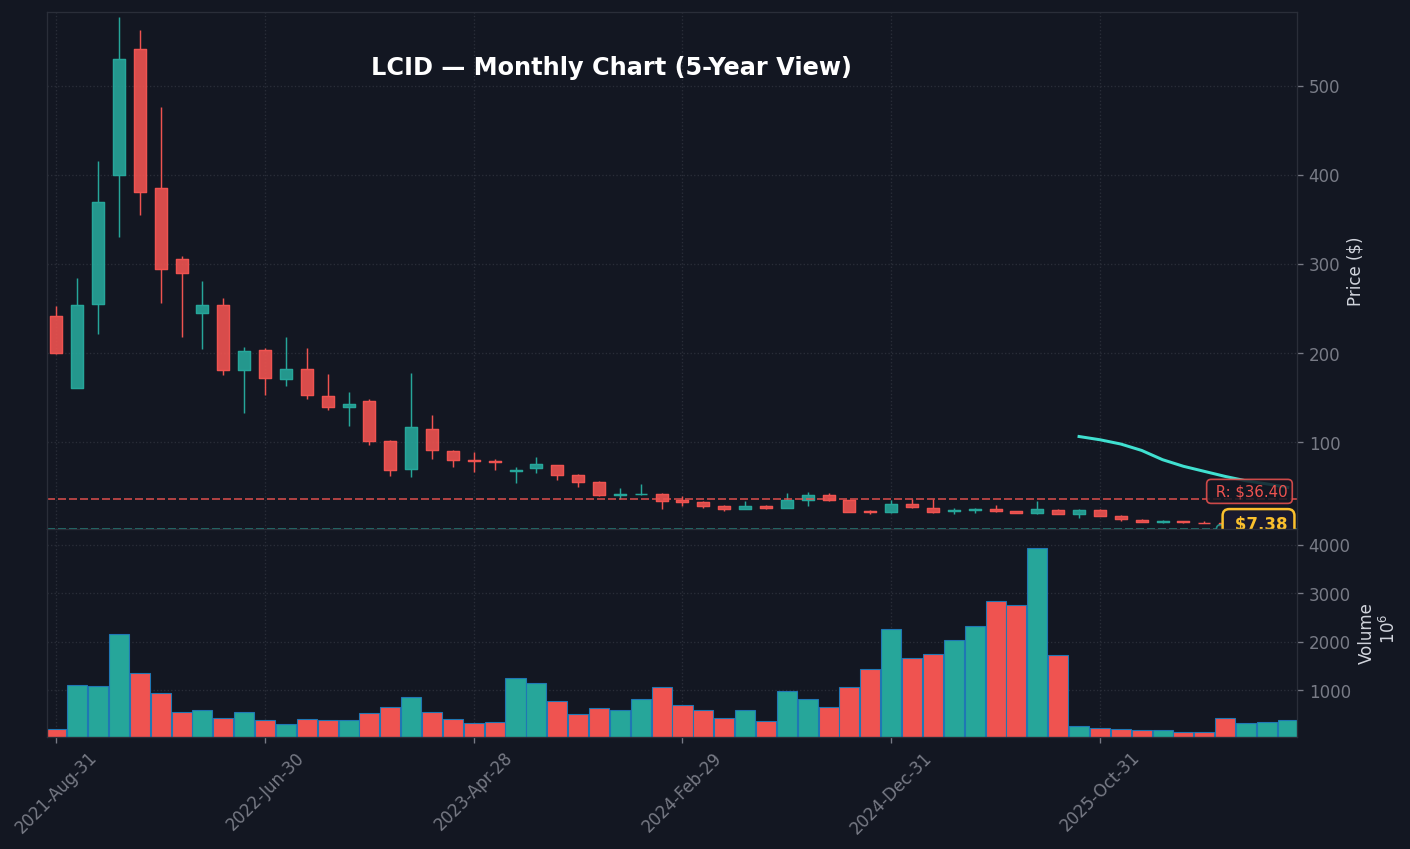
Communication Services leads the decliners at -1.90%, followed by Consumer Discretionary at -1.61%, per Market Data. Energy remains the lone green sector at +0.91%. This split is notable because the market is not selling everything indiscriminately; it is liquidating expensive growth and consumer cyclicality while preserving Energy exposure. Breadth supports this: ISRG is down 13.01% and NFLX is down 7.55%, yet LCID is up 14.82% and TRV is up 8.36%, confirming that traders are still willing to chase company-specific momentum.
S&P 500 at 7,448.8: The Level That Decides the Close
The S&P 500 sits at 7,448.8, below the 50-day SMA of 7,464.69, while RSI(14) sits at 57.8 and MACD is at 25.122, per Market Data. The nearest actionable level is 7,464.69 as it separates a trend reclaim from a bearish close. Worth noting: RSI at 57.8 is not oversold, which implies dip buyers lack a “washed-out” justification. If buyers cannot reclaim 7,464.69, the market enters the next session with a cleaner bearish technical read.
What Is Confirmed Versus Missing on July 17?
Confirmed data shows the S&P 500 down 1.13%, Nasdaq Composite down 1.56%, and VIX up 11.36%, per Market Data. The known sector evidence points to risk-off behavior in growth-linked exposure. The takeaway is that consensus may be wrong to assume the VIX move is the entire story. The real signal is the divergence between VIX, 10-year yields, and the relative strength of the Energy sector.
Why Sticky CPI at 3.7% Limits the Rebound
CPI YoY is 3.7%, the Fed Funds Rate is 3.63%, and unemployment is 4.2%, per FRED data. This macro regime dictates that equity rallies require earnings support; they cannot rely on a quick Fed-cut narrative. The disconnect is that while index investors seek lower rates to support long-duration equities, the selloff is hitting exactly those growth-heavy sectors. Until Technology and Communication Services stabilize, lower yields provide an incomplete bullish argument.
S&P 500: 7,464.69 SMA Pivot
- What to watch: If the S&P 500 reclaims the 7,464.69 50-day SMA, this confirms the late-day selling was a transient headline-driven shakeout.
- What would invalidate this: If the index fails to reclaim 7,464.69 and the Nasdaq Composite breaks further below current levels, this confirms a leadership unwind.
- Key trigger: Confirmed details behind the high-priority market alert after 03:26 PM ET; any macro policy shift would confirm a sustained downward trend.
Which Levels Matter After the 03:26 PM ET Selloff?
The 7,464.69 50-day SMA is the primary pivot, as the index currently trades at 7,448.8, per Market Data. The 20-day VIX average of 16.9 serves as the secondary checkpoint for volatility mean-reversion, while the 4.54% 10-year Treasury yield dictates whether the selloff remains equity-specific or expands into a broader macro risk event.
Frequently Asked Questions
Why did VIX jump on July 17, 2026?
VIX rose 11.36% to 18.63 while the S&P 500 fell 1.13% to 7,448.8 and Nasdaq Composite lost 1.56%, per Market Data. The prompt identifies a HIGH-priority market alert but does not provide the underlying event details, so the confirmed read is fast downside hedging rather than a fully attributed macro shock.
What S&P 500 level matters most after the July 17 alert?
The nearest actionable level is the S&P 500 50-day SMA at 7,464.69, per Market Data. The index was at 7,448.8 at 03:26 PM ET, so a reclaim would reduce technical pressure, while a close below it would leave the market under a widely watched trend marker.
What does the bond market say about the July 17 stock selloff?
The 10-year Treasury yield was down 0.61% to 4.54% while VIX jumped 11.36%, per Market Data. That combination suggests investors are cutting equity risk and buying protection, but bonds are not yet confirming a fresh inflation-rate shock.
Data sources: Yahoo Finance · SEC EDGAR · StockStory · Simply Wall St.
This article is for informational purposes only and does not constitute financial advice. Always do your own research before making investment decisions.