At 12:04 PM ET on July 15, 2026, is the tape confirming a broad risk-off break? No: the S&P 500 is holding 7,545.97, up 0.03%, while the Nasdaq Composite is up 0.13% and the Dow Jones is up 0.22%, per Market Data.
The first-order consequence of this market alert is not index-level panic; it is sector-level damage inside an otherwise flat tape. Technology is down 2.17%, Energy is down 1.65%, and Industrials are down 1.09%, while Communication Services is up 1.85%, Consumer Discretionary is up 1.13%, and Financials are up 0.98%, per Market Data. What stands out here is the split: traders are selling crowded growth exposure, not everything with a CUSIP.
The key risk is that traders mistake the first knee-jerk move for the full market message before liquidity and confirmation arrive. The nearest actionable S&P 500 level is 7,453.69, the 50-day moving average, because the index is still above that line despite a 70.4 RSI that signals an overbought market, per Market Data. In a sticky CPI regime, upside should be treated as constrained until the index either defends that 50-day line or loses it with volume confirmation.
Why Did Technology Fall 2.17% While the S&P 500 Held 7,545.97?
Technology is the stress point because the sector is down 2.17% even with the S&P 500 at 7,545.97, per Market Data. That means the index is being supported by non-tech strength, especially Communication Services at +1.85%, Consumer Discretionary at +1.13%, and Financials at +0.98%.
The second-order implication is more important than the headline move. A flat S&P 500 with Technology down 2.17% means the market is rotating away from the most duration-sensitive and positioning-heavy part of the equity book. That is consistent with a sticky CPI regime, where the Fed Funds Rate is 3.63%, CPI is 3.7% year over year, and the 10-year Treasury is still 4.62% as of July 13, per FRED data.
What the tape is not pricing yet is how narrow the cushion may be if Technology selling spreads into Communication Services or Consumer Discretionary. Those two sectors are doing the offsetting work right now. If they fade, the S&P 500 can move from a flat headline print to a real downside break quickly because the 50-day average is only one failed support zone away at 7,453.69, per Market Data.
Nasdaq 100 futures add a second confirmation point. They are down 0.71% at 29,579.75, while S&P 500 futures are up 0.06% at 7,596.0 and Dow futures are up 0.22% at 52,909.0, per Market Data. That spread says traders are isolating the hit in long-duration growth rather than marking down the entire economy.
The judgment here is simple: a Technology-led drawdown with the VIX falling is not the same trade as a broad risk-off shock. It is a leadership test. If Technology stabilizes, the market alert can fade into a rotation day. If Technology remains down more than 2% into the final hour, the closing print will matter more than the noon index level.
How Did the 4.55% 10Y Yield Shape the July 15 Alert?
The 10-year Treasury yield is at 4.55%, down 0.79% on the session, per Market Data, while the FRED snapshot shows the 10-year at 4.62% with a 5-day change of +7 basis points as of July 13. That combination tells us rates are not confirming an inflation panic today.
The cross-asset bridge is the 10Y-2Y spread. FRED data shows the 2-year Treasury at 4.26% and the 10Y-2Y spread at +0.36 percentage point. A positive 2s10s slope with sticky 3.7% CPI does not scream imminent recession; it says the market is balancing delayed Fed cuts against a still-functioning growth tape.
The broad Dollar Index is 120.50, down 0.27% over 5 days, per FRED data. A softer dollar alongside a lower VIX would normally help risk assets, but Technology’s 2.17% drop shows that equity positioning is overpowering the calmer macro signal. Counterintuitively, the bond market is not the source of today’s stress based on the supplied numbers; the equity sector map is.
That is why the market alert should be read through confirmation rather than assumption. If yields were spiking and the dollar were surging, the macro explanation would be cleaner. Instead, the alert is landing in a market where the Fed path is still constrained by 3.7% CPI, but today’s immediate selling pressure is concentrated in equity leadership.
The overlooked signal is VIX. At 16.13, it is below the 20-day average of 17.0, per FRED and Market Data snapshots. That is not a complacency badge; it is a liquidity clue. Options markets are not yet charging panic premiums, which raises the risk that late-day cash selling, if it arrives, catches traders positioned for a contained move.
NVDA, AMD, INTC: Chip Weakness Is the Risk Signal
Semiconductors are where the market alert becomes more than an index headline. NVDA is down 1.80% to 207.99, AMD is down 5.96% to 515.47, INTC is down 7.02% to 100.19, MU is down 9.01% to 894.52, and TSM is down 1.15% to 415.56, per Market Data.
Those moves matter because they sit inside the Technology sector’s 2.17% decline. The index can hide that damage when AAPL is up 3.77% to 326.74 and AMZN is up 2.97% to 254.85, per Market Data. But the semiconductor tape is not healthy. It is telling traders that the market is separating platform winners from hardware and memory exposure.
Where consensus is wrong is assuming a flat S&P 500 means the growth trade is fine. The semiconductor cluster says otherwise. If AMD is down 5.96%, INTC is down 7.02%, and MU is down 9.01% while the S&P 500 is still positive, then passive index levels are masking active de-risking underneath the surface.
This is the part of the market alert that deserves the closest follow-through into the close. If NVDA remains down less than 2% while AMD, INTC, and MU stay under pressure, the market is not rejecting artificial intelligence exposure broadly; it is repricing the weaker links inside the supply chain. If NVDA breaks lower with the rest of the group, the read-through gets heavier for Nasdaq 100 futures at 29,579.75, per Market Data.
AEHR +24.45%, PYPL +15.86%, ANGO +11.46%: Dispersion Is Not Panic
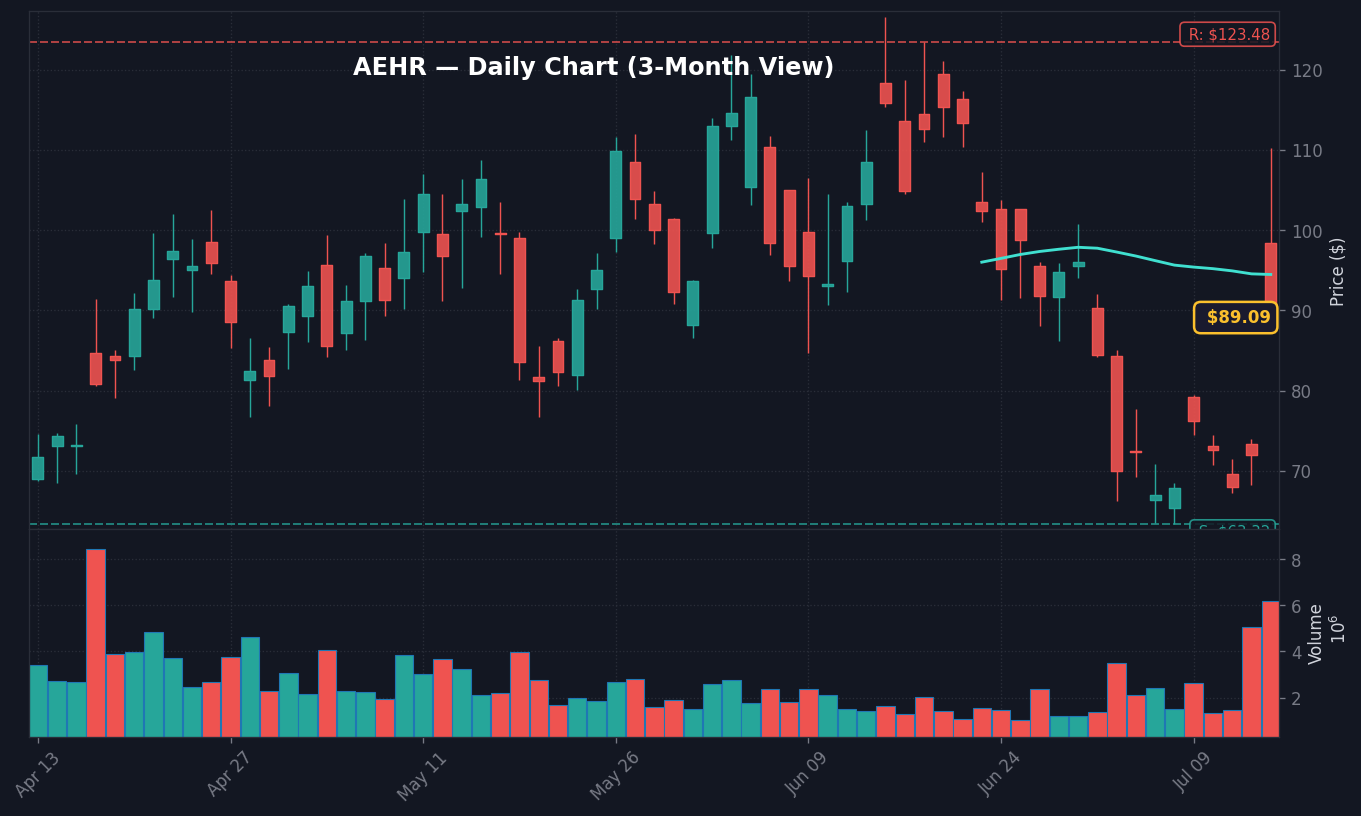
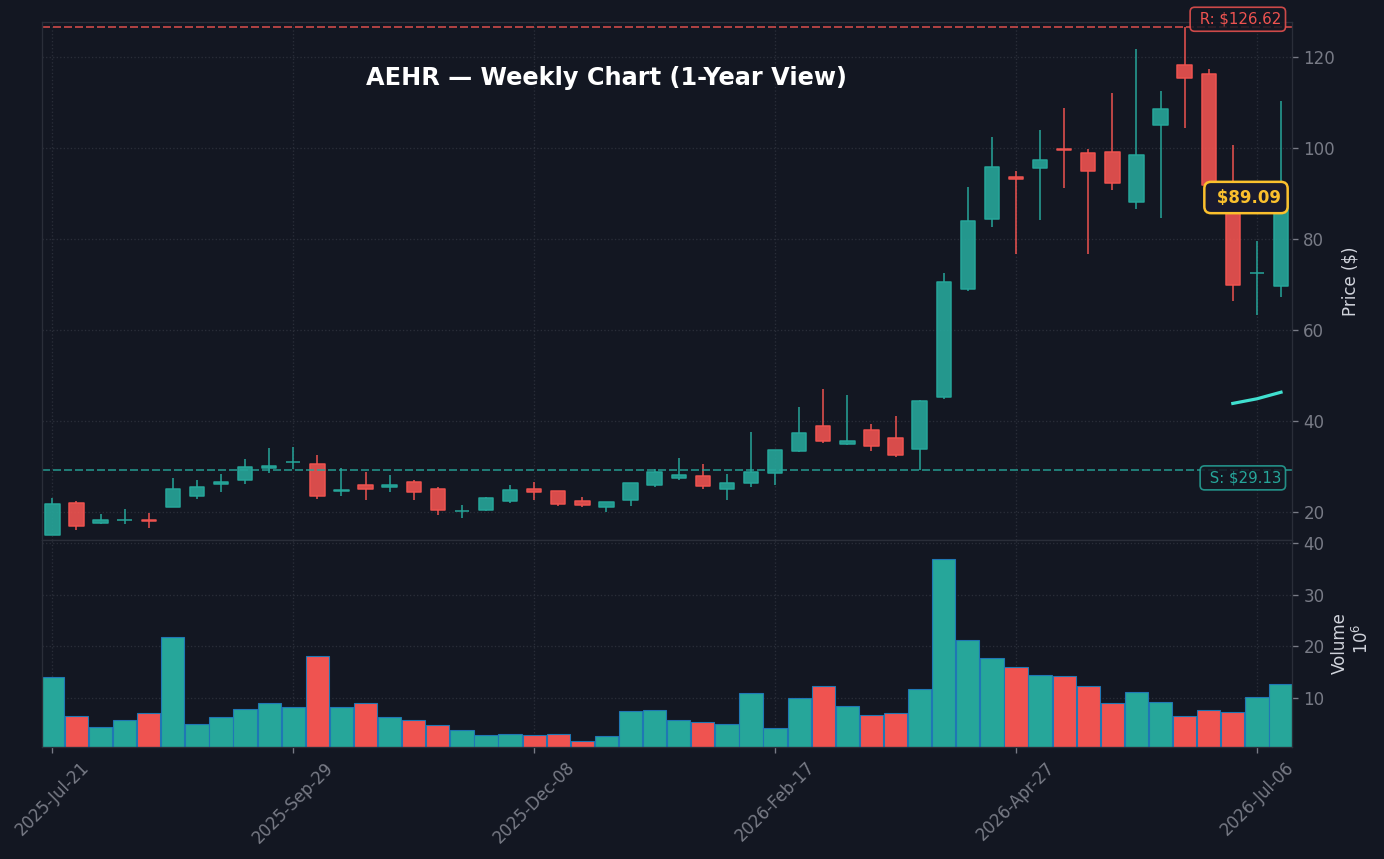
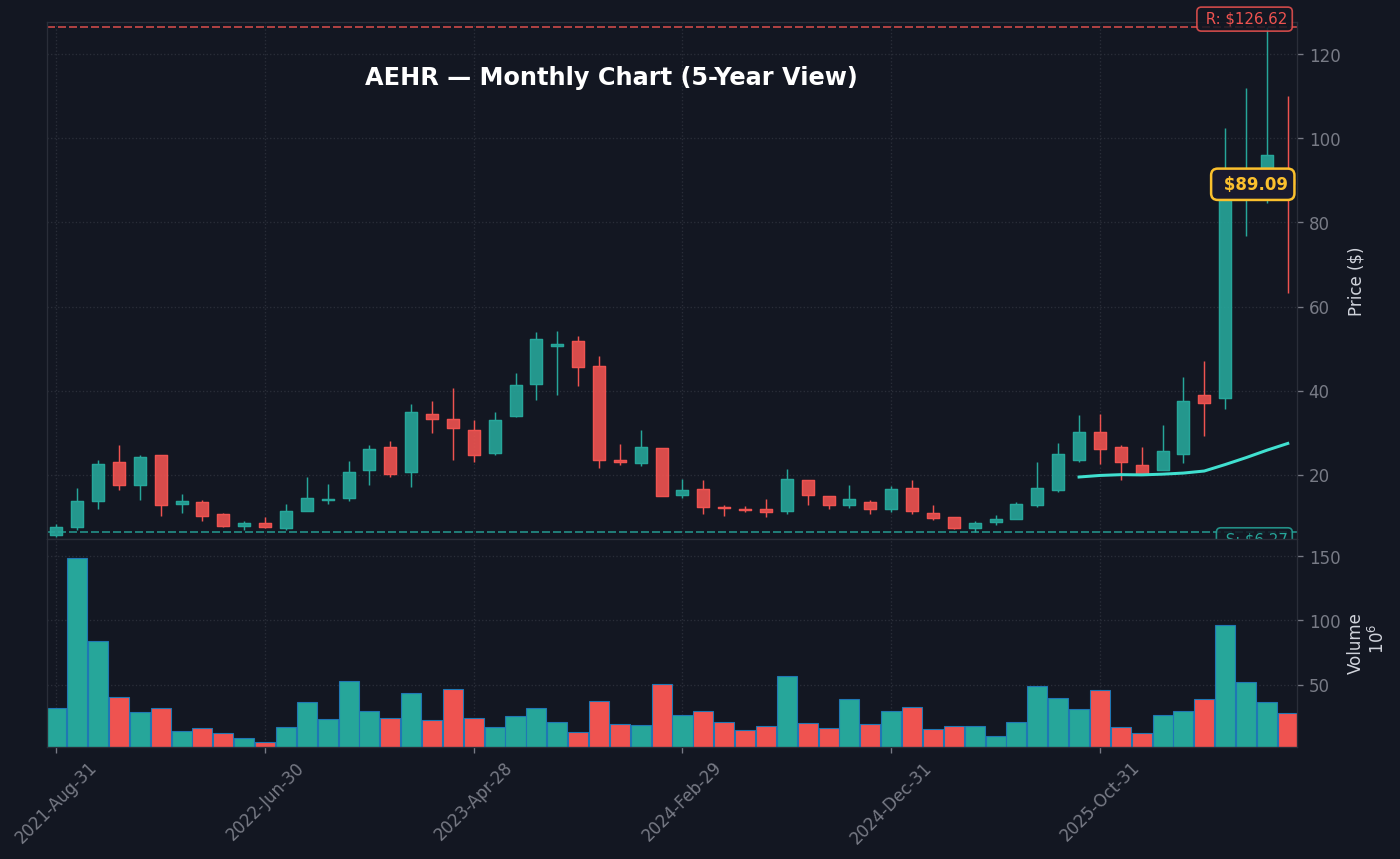
The strongest single-name moves argue against a one-way liquidation. AEHR is up 24.45% to 89.62, LCID is up 19.61% to 5.53, PYPL is up 15.86% to 54.88, and MANE is up 15.93% to 127.72, per Market Data. A market with multiple double-digit winners is not behaving like a forced selloff.
ANGO is up 11.46% to 14.49, and the supplied source context says AngioDynamics beat Q4 earnings estimates and expanded gross margin, per the company earnings release. The exact earnings figures were not supplied, so they should not be inferred. The valid read is that company-specific catalysts are still being rewarded even as Technology leadership comes under pressure.
On the downside, CELC is down 19.87% to 88.98, PNR is down 16.78% to 62.98, SNDK is down 13.09% to 1,527.77, and DELL is down 12.31% to 401.23, per Market Data. That is real damage. But it is paired with large winners, which makes the day a dispersion event rather than a clean macro sell program.
Worth noting: the losers list includes several hardware, storage, and technology-adjacent names, including DELL at -12.31%, WDC at -9.42%, STX at -8.84%, and NTAP at -9.53%, per Market Data. That reinforces the same point from the sector tape. The pressure is concentrated where earnings expectations, capital spending sensitivity, and valuation duration are most exposed.
The market alert is therefore not just about the S&P 500 being flat. It is about the market deciding which earnings streams still deserve a premium when CPI is sticky at 3.7% and the Fed Funds Rate is 3.63%, per FRED data. That is a harder tape than the headline index level suggests.
Bull/Base/Bear Around S&P 500 7,453.69
The scenario map should start with the nearest level, not a narrative. The S&P 500 is at 7,545.97, the 50-day moving average is 7,453.69, and S&P 500 futures are at 7,596.0, per Market Data. Those three numbers define the risk/reward better than the word “alert” does.
Bull Case: Hold 7,545.97 and Reclaim 7,596.0 Futures
The bull case requires the S&P 500 to hold near 7,545.97 while Nasdaq 100 futures narrow the 0.71% loss at 29,579.75, per Market Data. If that happens, the next upside reference is the S&P 500 futures mark at 7,596.0. The reward is roughly the distance from cash at 7,545.97 to futures at 7,596.0, while the risk line stays the 50-day average at 7,453.69.
Base Case: Rotation Above the 7,453.69 SMA 50
The base case is a choppy rotation as long as the S&P 500 stays above 7,453.69 and VIX stays below its 17.0 20-day average, per Market Data and FRED data. That would fit today’s sector map: Communication Services +1.85%, Financials +0.98%, and Technology -2.17%. The market can absorb that mix, but it cannot call it clean strength.
Bear Case: Lose 7,453.69 With Tech Still Down More Than 2%
The bear case starts if the S&P 500 loses 7,453.69 while Technology remains down more than 2.17% and Nasdaq 100 futures remain negative near 29,579.75, per Market Data. That would turn the market alert from contained dispersion into a failed-support signal. The downside level supplied in the data is 7,453.69; no lower technical target was provided.
The asymmetry is not dramatic at the index level yet, but it is meaningful under the surface. The upside path needs a rebound in Technology or continued support from Communication Services and Consumer Discretionary. The downside path needs only one thing: the current semiconductor weakness spilling into the broader index close.
What Should Traders Watch After the July 15 Alert?
Traders should watch the S&P 500 at 7,453.69, Nasdaq 100 futures at 29,579.75, and Technology’s 2.17% sector loss, per Market Data. Those are the live confirmation points. The market alert does not become broad risk-off unless the weakness spreads beyond semiconductors and hardware into the index supports.
The next hard catalyst was not supplied with the alert feed. That matters because a missing catalyst increases the risk of over-reading the first move. The tape needs confirmation from price, not assumption: S&P 500 above 7,453.69 means rotation; below 7,453.69 means the alert has moved from headline risk to support failure.
What to Watch: S&P 500 7,453.69 SMA 50
- Watch whether the S&P 500 holds above 7,453.69, its SMA 50, while the Nasdaq 100 futures discount at 29,579.75 stabilizes, per Market Data.
- Key level: 7,453.69, the S&P 500 50-day moving average; a break would turn today’s 7,545.97 cash print from range support into failed support.
- If the S&P 500 stays above 7,453.69 and VIX remains below its 17.0 20-day average then the first read is controlled rotation, not broad liquidation.
- Trigger: next confirmation after the 12:04 PM ET July 15, 2026 market alert; no dated official release or company-specific headline was supplied with the alert feed.
Frequently Asked Questions
Why is the S&P 500 flat near 7,545.97 on July 15?
The S&P 500 is at 7,545.97, up 0.03%, because strength in Communication Services, Consumer Discretionary, and Financials is offsetting a 2.17% drop in Technology, per Market Data. The specific breaking headline was not supplied, so the clean read is sector rotation rather than a broad index selloff.
What level changes the July 15 market alert into a bearish signal?
The key level is 7,453.69, the S&P 500 50-day moving average, per Market Data. If the index loses that level while Technology remains down more than 2.17%, the alert shifts from contained dispersion to failed support.
Why are chip stocks weaker while VIX is only 16.13?
NVDA is down 1.80%, AMD is down 5.96%, INTC is down 7.02%, and MU is down 9.01%, per Market Data, while VIX is 16.13 and below its 20-day average of 17.0. That combination points to concentrated semiconductor de-risking, not a full volatility shock.
Data sources: Yahoo Finance · SEC EDGAR · Zacks
Nothing in this article should be construed as a recommendation to buy or sell any security. Past performance does not guarantee future results.