4.59% on the 10-year Treasury yield is the first market signal at 09:40 AM ET on July 16: the equity tape is absorbing a HIGH-priority market alert with the S&P 500 down 0.35% to 7,545.53, the Nasdaq Composite down 0.77% to 26,066.63, and the Dow Jones up 0.14% to 52,730.96, per Market Data.
The driver is not a fully specified headline in the supplied event feed; the breaking-events block is empty, so the article cannot honestly identify a named catalyst beyond the market alert itself. The first-order consequence is still clear: traders are rotating out of Technology, down 1.87%, and into Healthcare and Consumer Staples, both up 1.61%, per Market Data.
The risk is that traders treat the first 10 minutes of cash trading as the whole message. With VIX up 3.25% to 16.18 and still below the 20-day average of 17.0 from the macro snapshot, this is stress, not yet disorder; the tape is asking for confirmation before the alert becomes a full risk-off call.
Why Did the Nasdaq Drop 0.77% at 09:40 AM ET?
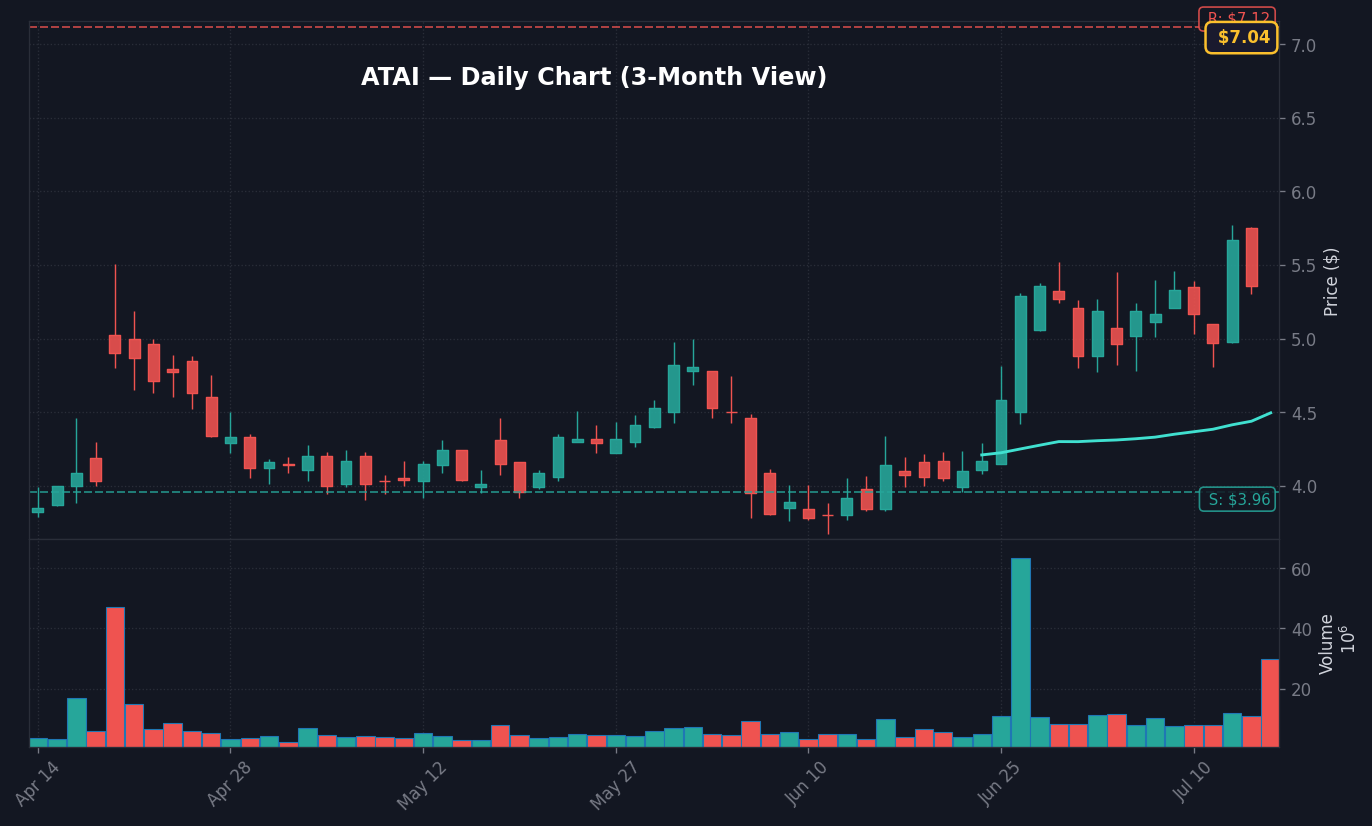
ATAI Daily Chart — 3-month view with SMA50/200
The Nasdaq Composite is down 0.77% at 26,066.63 because the weakest pocket of the tape is Technology, down 1.87%, per Market Data. That matters because the largest listed losers in the supplied market map cluster around semiconductors, AI infrastructure, memory, networking, and hardware names rather than defensives.
NVDA is down 1.97% to 208.32, AMD is down 2.82% to 514.20, AVGO is down 3.85% to 379.09, TSM is down 2.27% to 410.15, and INTC is down 3.36% to 99.53, per Market Data. That is not a single-stock air pocket. It is a factor unwind in the part of the market most sensitive to duration, capex expectations, and crowded positioning.
What stands out here is the clean separation between index-level damage and sector-level damage. The S&P 500 is down only 0.35%, but Technology is down 1.87%, which means the headline index is being cushioned by rotation rather than broad demand. That is a different message from a market-wide liquidation.
The cross-asset bridge is the 10-year Treasury yield at 4.59%, up 0.90% on the session and above the 4.58% level in the July 14 macro snapshot, per Market Data and FRED data. In a sticky CPI regime with CPI YoY at 3.7% and Fed Funds at 3.63%, per FRED data, higher yields compress the valuation room for long-duration tech before they necessarily break the whole market.
The market alert therefore reads as a leadership problem first and an index problem second. If the 10-year yield holds near 4.59% while Technology remains below the rest of the tape, the next trade is not simply “stocks down.” It is a valuation reset in Nasdaq-heavy growth exposure while defensive equity cash flow gets a relative bid.
How Are Bonds, Dollar, VIX, and Sectors Framing the Alert?
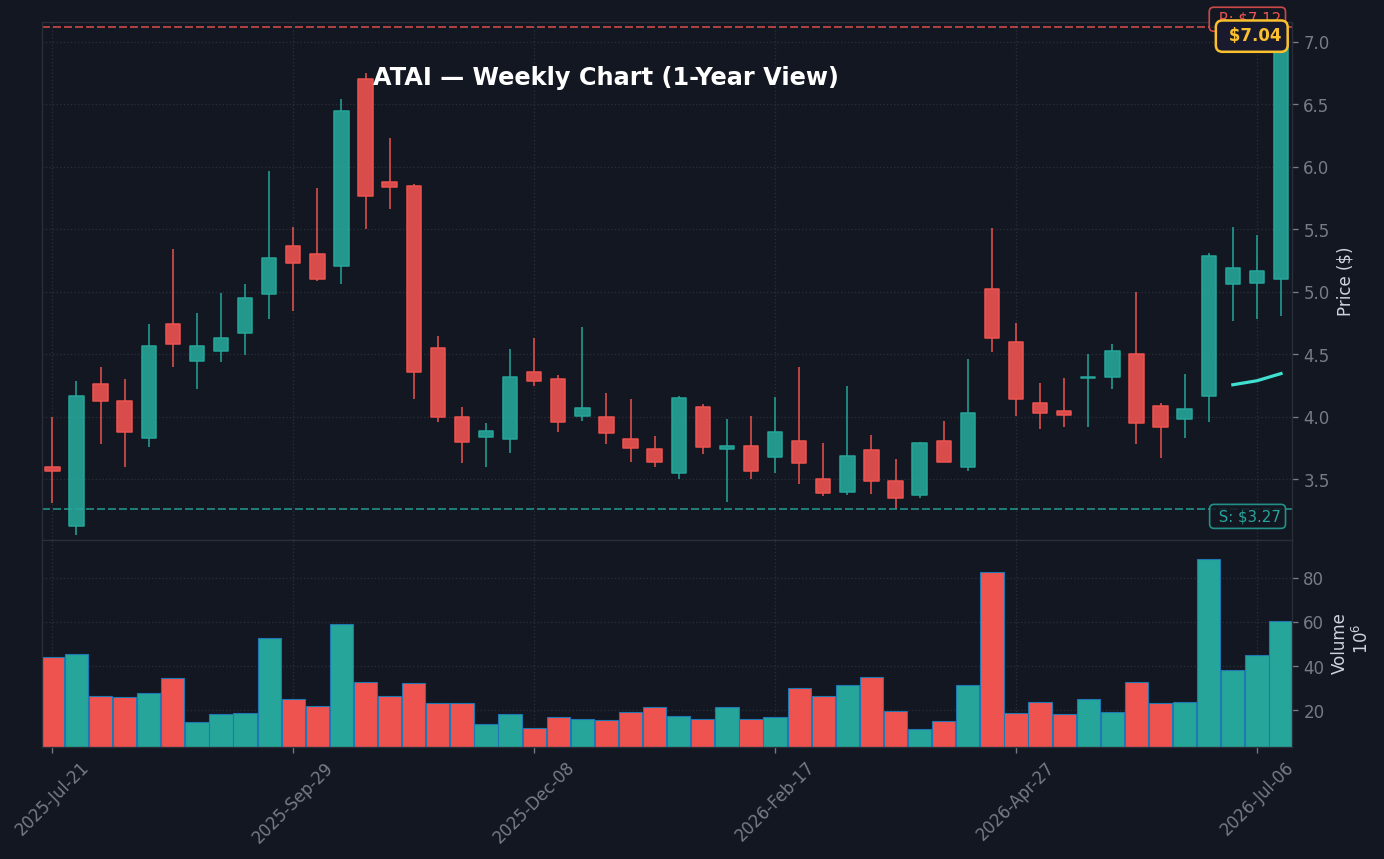
ATAI Weekly Chart — 1-year view with SMA50/200
Bonds are delivering the cleanest macro message: the 10-year Treasury yield is 4.59%, while the 2-year Treasury yield in the macro snapshot is 4.18%, leaving the 10Y-2Y spread at 0.40 percentage points, per FRED data. That positive spread says the market is not pricing a classic front-end recession panic.
The Dollar Index broad measure is 120.50, down 0.27% over five days, per FRED data. That matters because a dollar spike is not the confirmed source of this 09:40 AM ET pressure. The tape is instead showing a rates-and-positioning shock concentrated in Technology, while defensive equity groups absorb cash.
Volatility is louder than yesterday but not extreme. VIX is 16.18, up 3.25% in current market data, versus a 20-day average of 17.0 in the macro snapshot. The overlooked signal: VIX rising while still sitting below its 20-day average argues against calling this a panic without another confirming leg in credit, rates, or index breadth.
Sector dispersion is the story. Healthcare and Consumer Staples are each up 1.61%, Real Estate is up 0.83%, Energy is up 0.48%, Utilities are up 0.35%, and Consumer Discretionary is up 0.26%, per Market Data. Technology is down 1.87%, Industrials are down 0.21%, and Financials are down 0.05%, per Market Data.
That sector map is defensive, but it is not indiscriminate. Real Estate rising 0.83% while the 10-year yield is 4.59% is counterintuitive, because higher yields usually pressure rate-sensitive groups. The likely message from the supplied data is not “rates are fine”; it is that investors are treating the Technology drawdown as a positioning event and looking for lower-beta shelters.
SPX 7,461.09 Is the Must-Watch Level After the 7,545.53 Print
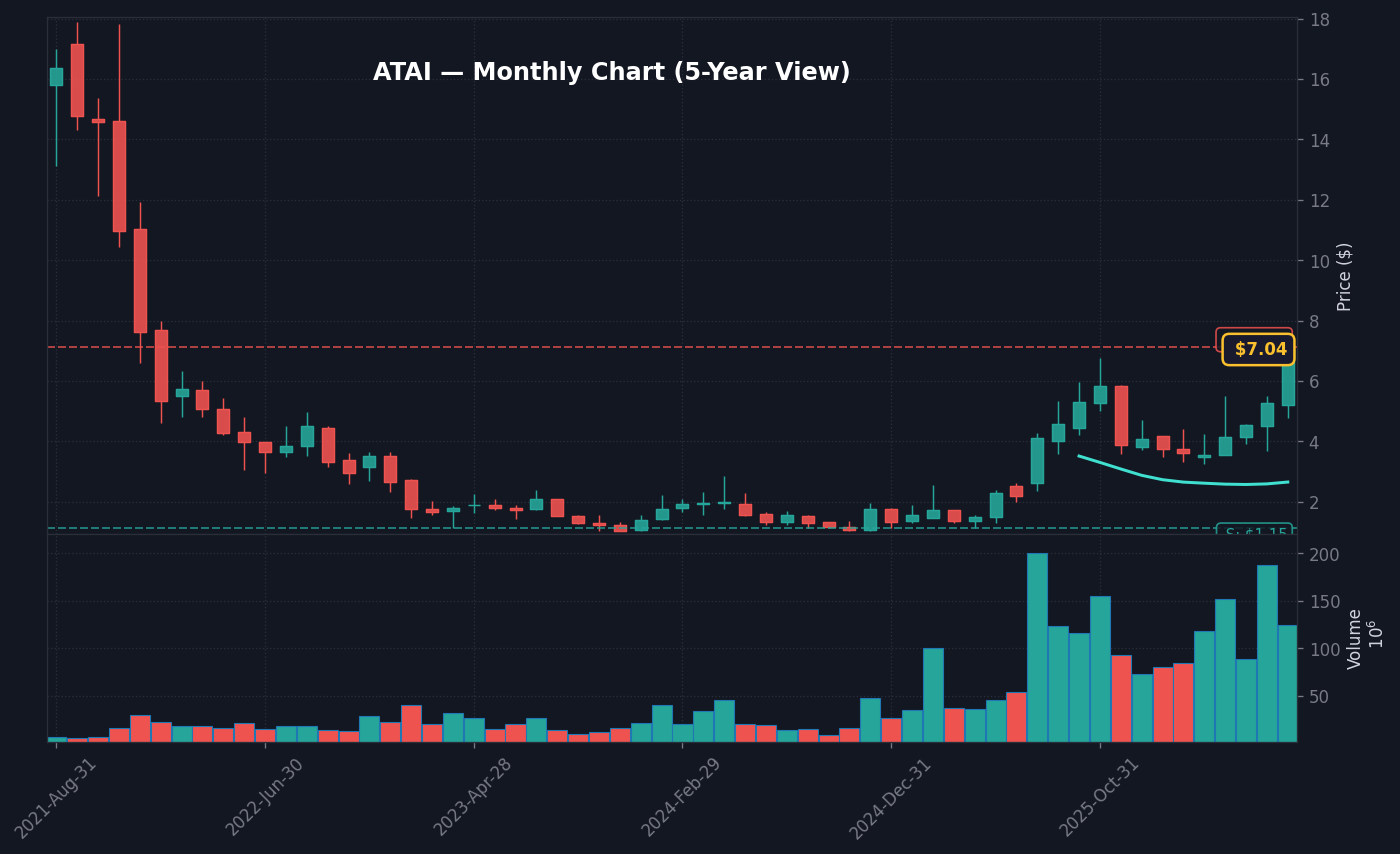
ATAI Monthly Chart — 5-year view with SMA50/200
The nearest actionable S&P 500 level is the 50-day SMA at 7,461.09, with the index currently at 7,545.53, per the supplied technical indicators and Market Data. That gives the S&P 500 roughly 84.44 index points of cushion before the market tests its most relevant short-term trend marker.
The technical setup is not broken yet. RSI(14) is 68.08 and labeled neutral, MACD is 34.5993 versus a signal line of 28.2503, there is no MACD crossover, and the S&P 500 remains inside its Bollinger Bands, per the supplied technical indicators. Those facts argue against treating the first move as a confirmed trend reversal.
But the sticky-inflation regime constrains the upside thesis. With CPI YoY at 3.7% and the Fed Funds Rate at 3.63%, per FRED data, the market has less room to rally on the hope of quick policy relief. A higher-for-longer backdrop makes the 7,461.09 level more important because dip buyers need earnings confidence, not just rate-cut speculation.
Worth noting: the S&P 500 can hold above the 50-day SMA even while the Nasdaq continues to bleed if defensive sectors keep offsetting megacap tech pressure. That would look stable at the index level but still painful for traders concentrated in NVDA, AVGO, AMD, TSM, PLTR, MU, and INTC.
NVDA, AVGO, AMD, and TSM Show the Real Spillover
The Technology selloff has a clear semiconductor center. NVDA is down 1.97%, AVGO is down 3.85%, AMD is down 2.82%, TSM is down 2.27%, MU is down 3.16%, and ARM is down 6.06%, per Market Data. That is the key spillover channel from the 09:40 AM ET market alert.
AI infrastructure names are also under pressure beyond the chip designers. ALAB is down 4.96%, CRDO is down 3.00%, APH is down 2.15%, CLS is down 3.47%, CIEN is down 3.89%, and DELL is down 1.22%, per Market Data. The market is marking down the hardware chain together, which signals a broader de-risking of the AI supply stack.
Memory and storage are weaker as well. WDC is down 4.64%, STX is down 5.51%, SNDK is down 5.80%, and MU is down 3.16%, per Market Data. This matters because storage and memory stocks tend to be treated as cycle-sensitive reads on end demand, not just valuation proxies.
Where consensus is wrong is in treating every Technology selloff as the same trade. The supplied data show a concentrated unwind in semiconductor, AI infrastructure, memory, and connectivity names while Healthcare and Consumer Staples are both up 1.61%. That is not a clean recession trade. It is a crowded-growth repricing in a sticky-CPI environment.
DSGR +25.25% Shows Single-Stock News Is Still Working
DSGR is up 25.25% to 34.42 after the supplied source set identifies “Distribution Solutions shares jump after $35-a-share take-private agreement,” per Market Data. That single-stock gain matters because it shows idiosyncratic catalysts are still being rewarded even as the broader Technology tape sells off.
The $35 take-private reference also gives traders a clean deal-price anchor. DSGR at 34.42 trades below the $35 agreement price identified in the supplied source, per Market Data, leaving a visible spread rather than a momentum-only move. That is a different risk profile from the semiconductor weakness, where the supplied data do not include a named company event.
This is the important distinction for active traders at 09:40 AM ET: the market alert is not freezing all risk appetite. It is punishing one crowded equity factor while still allowing deal-linked and earnings-linked movers to trade on their own facts.
ABT +11.27%, UNH +8.53%, and MAN +27.10% Define Leadership
Healthcare is leading with the sector up 1.61%, and the stock-level map shows ABT up 11.27% to 99.42 and UNH up 8.53% to 454.29, per Market Data. Consumer Staples is also up 1.61%, giving the market a defensive bid as Nasdaq weakness pulls on the headline indices.
MAN is up 27.10% to 49.58, RHI is up 8.29% to 39.75, JBHT is up 6.15% to 293.27, and CTAS is up 6.30% to 204.48, per Market Data. Those moves are large enough to matter because they show leadership is not confined to classic bond proxies.
The disconnect is that the Dow Jones is up 0.14% to 52,730.96 while the Nasdaq Composite is down 0.77% to 26,066.63, per Market Data. That is exactly what a rotation tape looks like: index divergence, defensive leadership, and pressure in the most crowded growth names.
The first-order trading consequence is simple. If leadership stays in Healthcare, Staples, and selected industrial or services names while Technology remains down near 1.87%, the S&P 500 can mask more damage under the surface than the 0.35% headline decline suggests.
3 Scenarios From the 7,545.53 S&P 500 Level
3 Scenarios From Here
Bull: S&P 500 holds above the 50-day SMA at 7,461.09 and Technology narrows its 1.87% loss by midday → SPX stabilizes back toward the 7,595.75 futures reference by the next cash confirmation window.
Base: S&P 500 stays between 7,461.09 and 7,545.53 while VIX remains below its 20-day average of 17.0 → rotation continues, with Healthcare and Staples leadership offsetting Nasdaq pressure.
Bear: S&P 500 loses 7,461.09 while Nasdaq remains down at least 0.77% and VIX pushes above 17.0 → the alert shifts from Technology repricing to broader index risk.
The asymmetry is not about whether stocks are green or red at 09:40 AM ET. It is about whether the 7,461.09 50-day SMA holds while VIX stays contained. Above that level, the tape can absorb a Technology drawdown. Below that level, the market loses the technical argument that this is only sector rotation.
Sticky inflation is the constraint on the bull case. CPI YoY is 3.7%, the Fed Funds Rate is 3.63%, and the 10-year yield is 4.59%, per FRED data and Market Data. That combination leaves less room for a fast multiple rebound unless yields back away or earnings leadership broadens outside Technology.
What to Watch: S&P 500 7,461.09 and Technology -1.87%
Watch whether the S&P 500 holds above its 50-day SMA at 7,461.09 after opening at 7,545.53, per the supplied technical indicators and Market Data.
Key level: 7,461.09 on the S&P 500, because it is the nearest actionable trend level below the 09:40 AM ET cash print.
If Technology stays down near 1.87% while VIX moves above the 20-day average of 17.0 then the market alert shifts from sector rotation to broader risk-off confirmation.
Trigger: Next hard catalyst is the next confirmed market-data update after the 09:40 AM ET July 16 alert, because the supplied breaking-events feed did not include a named official release time or company headline.
Next Session Watchpoints
Volume profile: Watch whether ATAI keeps at least 6.5x average.
Key level to watch: Use today’s nearest actionable S&P 500 level from the supplied technicals and explain why it matters. is the pivot for continuation.
Catalyst quality: The move needs follow-through headlines or clean price acceptance above the pivot.
Risk trigger: If ATAI loses the opening range quickly, the move shifts from continuation to fade risk.
Frequently Asked Questions
Why is the S&P 500 down on July 16, 2026?
The S&P 500 is down 0.35% to 7,545.53 at 09:40 AM ET, per Market Data. The supplied breaking-events feed does not name a specific catalyst, so the measurable driver is sector rotation: Technology is down 1.87% while Healthcare and Consumer Staples are each up 1.61%.
What S&P 500 level matters after the 09:40 AM ET market alert?
The nearest actionable S&P 500 level is the 50-day SMA at 7,461.09, per the supplied technical indicators. Holding that level keeps the alert in rotation territory; losing it would make the 0.35% index decline look more like a broader technical break.
Why are semiconductor and AI infrastructure stocks weak today?
The supplied market data show concentrated Technology weakness, with NVDA down 1.97%, AMD down 2.82%, AVGO down 3.85%, TSM down 2.27%, and ARM down 6.06%. With the 10-year Treasury yield at 4.59% and CPI YoY at 3.7% per FRED data, long-duration growth stocks have less room for valuation support.
This article is for informational purposes only and does not constitute financial advice. Always do your own research before making investment decisions.