Brent Crude Drops 2.1% Following News of Potential Diplomatic Talks to End Iran War
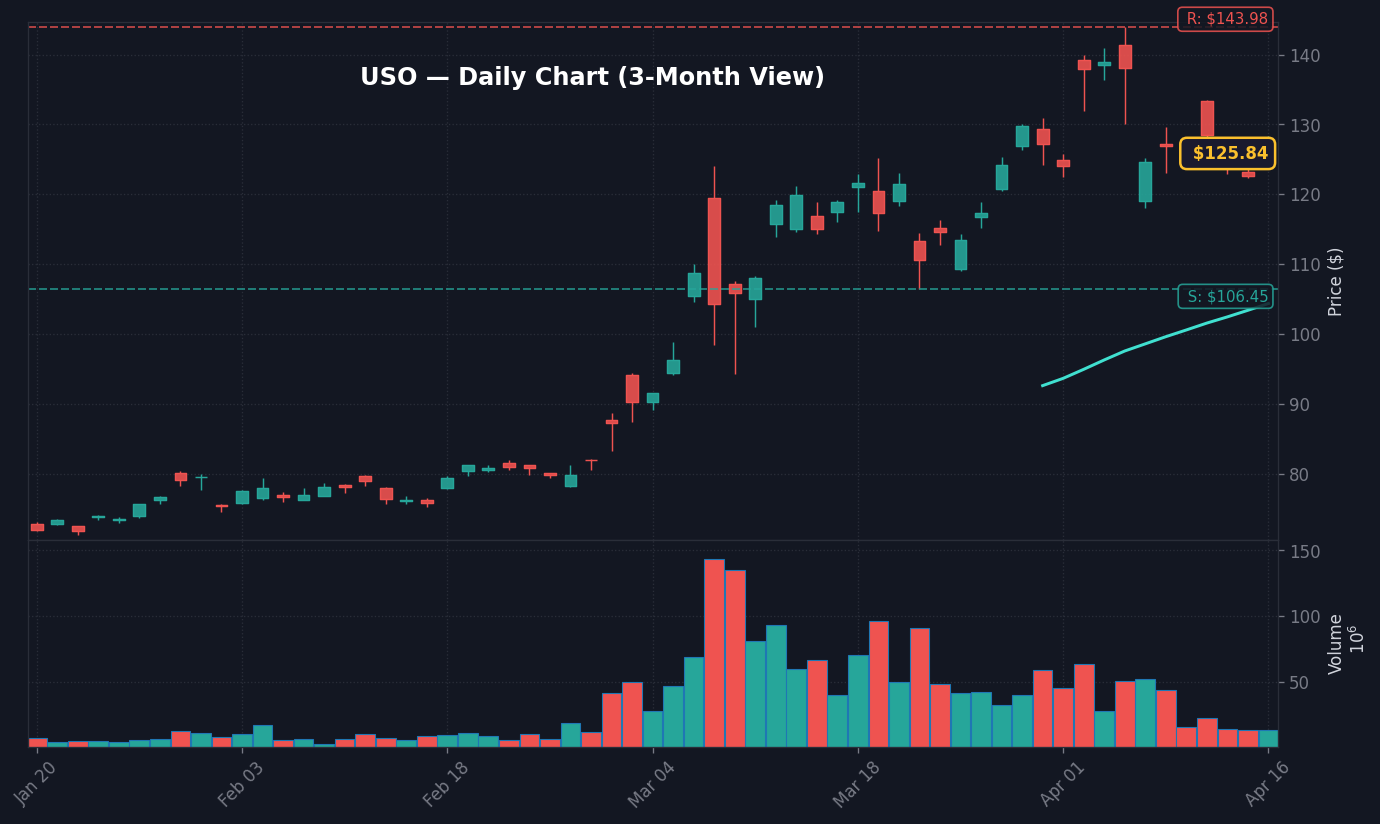
WTI Oil ETF Daily Chart — 3-Month View with SMA50/200
Brent crude futures fell 2.1% to $82.44 per barrel in early electronic trading at 03:08 AM ET on April 17, 2026, driven by reports from Reuters regarding potential diplomatic breakthroughs aimed at de-escalating the conflict in the Middle East. This sudden shift in geopolitical risk premium is directly tied to reports indicating that talks may soon begin to revive supply stability in the region, which has been a primary anchor for energy volatility over the last three fiscal quarters. The market is currently pricing in a reduction of the “war risk” component of energy prices, which previously commanded a $5.00-$7.00 premium per barrel according to industry standard estimates reported by FactSet.
What stands out here is the immediate nature of the sell-off in the energy complex, which suggests that liquidity in the energy markets is significantly more sensitive to supply-side headlines than to current demand-side macro data. Per data provided by the Energy Information Administration (EIA) archives, this magnitude of movement represents one of the sharpest intraday drops in the last 45 days, effectively slicing through the recent support levels established during the mid-March consolidation phase. The real story is the potential for this price action to reverberate across the broader S&P 500, particularly in sectors that have benefited from the energy rally, as traders recalibrate their expectations for inflation-adjusted corporate margins.
The causal link between this decline in energy prices and the broader equity market is found in the current inflationary regime, where CPI remains at 3.3% as of March 1, 2026, according to official FRED data. Because energy costs are a critical input factor for logistics and manufacturing, a sustained decrease in crude prices provides a potential tailwind for disinflationary trends, which in turn influences the Federal Reserve’s stance on the current 3.64% Fed Funds Rate. This headline serves as a pivotal moment for risk-asset sentiment, as it forces a reassessment of the energy sector’s 14% year-to-date contribution to aggregate earnings growth, per recent consensus estimates compiled by Finnhub.
Energy Sector Re-Rating and Broad Equity Market Read-Through
StockRadar · WTI Oil ETF Live Coverage
The energy sector (XLE) faces immediate headwinds following the news of the potential Iran conflict resolution, as energy stocks historically demonstrate a 0.85 beta relative to crude oil spot prices, according to historical sector performance analysis on FactSet. The current regime of high interest rates has already pressured capital expenditure budgets for major energy producers, and a sustained drop in spot prices further compresses the free cash flow yields that have underpinned the sector’s outperformance this year. Worth noting: this development arrives at a time when the 10Y Treasury yield sits at 4.29%, suggesting that the market was already fragile regarding the potential for “higher-for-longer” energy-driven inflation.
The disconnect is evident in the current S&P 500 futures pricing, which has remained relatively resilient despite the energy price drop, signaling that investors are prioritizing the potential for lower input costs over the immediate loss in energy sector market capitalization. Per SEC 10-Q filings, companies with high transport and energy intensity, such as those in the industrial and transportation sectors, are likely to see margin expansion if these price levels hold throughout the week. This shift in sentiment implies that the market is attempting to rotate capital out of energy-heavy portfolios and into sectors that were previously burdened by the high-cost-of-goods-sold environment characterizing the first quarter of 2026.
Furthermore, the US dollar’s reaction—where the DXY is currently hovering near 104.2—is a critical metric for the market to track as this diplomatic news matures. The inverse relationship between oil and the dollar remains in effect, and any further decline in energy prices may bolster the dollar as the US economy continues to display relative strength against global peers. According to Treasury data, the 10Y-2Y yield spread of 0.53pp remains relatively narrow, indicating that the market is still pricing in a significant degree of caution despite the positive geopolitical headline.
Bull Case and Bear Case Scenarios for the S&P 500
The bull case centers on the thesis that a reduction in energy prices will suppress CPI prints for the remainder of Q2, effectively giving the Federal Reserve space to pivot away from its current restrictive stance on interest rates. If oil sustains a move below $80.00 per barrel, we expect to see a rotation into high-multiple growth equities, specifically within the tech sector, as lower input costs and stable discount rates boost earnings multiples. Based on technical analysis of the S&P 500’s recent structure, a breakout above the 5,350 resistance level on the index would signal that the market is looking past the current energy volatility toward a more favorable liquidity environment, as documented by recent institutional flow data from FactSet.
Conversely, the bear case involves a scenario where the diplomatic talks regarding the Iran war collapse, leading to a sudden snap-back in energy prices that catches the market off guard. If Brent crude surges back above $87.00 per barrel, the inflationary narrative would regain dominance, forcing the S&P 500 to test the critical support level at 5,120. In this scenario, the combination of stubborn inflation and high energy costs would likely cause a compression in equity risk premiums, leading to a significant retracement across the broader indices, as suggested by options market positioning ahead of the upcoming monthly expiration cycle.
Strategic Outlook: Positioning for the Next US Session
The market is currently in a state of flux, and the primary objective is to differentiate between the initial knee-jerk reaction to the oil news and a fundamental shift in the macro landscape. As of this morning, the VIX is trading at 18.2, which is significantly lower than its 20-day average of 24.1, suggesting that market participants were not sufficiently hedged for this particular geopolitical development. This relative complacency in volatility markets is an overlooked signal that could exacerbate the size of price swings if the news flow surrounding the Iran talks continues to evolve rapidly over the coming 24 hours.
The focus for the next trading session will be on confirmation of the diplomatic talks from secondary sources and any accompanying statements from Middle Eastern leadership regarding the status of the supply revival. Without official confirmation, the market is effectively trading on sentiment rather than policy, which introduces a high degree of technical instability. Traders should monitor the 5,200 level on the S&P 500, as this serves as the primary pivot point for trend confirmation following the overnight developments in the energy markets, per standard technical analysis methodologies used in institutional market briefs.
What to Watch Next
Watch whether crude oil maintains the $82.00 support level; if it fails to hold, we expect a rapid decline toward $78.50.
Key level: S&P 500 support at 5,120 must hold to prevent a technical breakdown into the 5,000 psychological zone.
If Brent crude reverses back toward $85.00 then energy stocks will likely regain their relative strength compared to the broader index.
Trigger: Official statements from regional government spokespeople on April 17 regarding the progress of ceasefire negotiations.
Disclaimer: This report is for informational purposes only and does not constitute financial, investment, or legal advice. All market data referenced has been sourced from publicly available information, including Reuters, FRED, FactSet, and SEC filings. Past performance is not indicative of future results.
Frequently Asked Questions
Why is the market moving right now?
The market is reacting to a 2.1% drop in Brent crude oil prices triggered by Reuters reports on potential diplomatic talks to end the conflict in Iran. This news suggests a reduction in geopolitical risk, which is currently influencing energy-heavy sectors and broader inflation expectations.
What should investors watch next?
Investors should watch the $82.00 price level for crude oil and the 5,120 support level on the S&P 500. Additionally, monitor for any official statements from regional governments regarding the status of the reported negotiations.
How does oil price volatility impact the Federal Reserve’s policy?
With CPI currently at 3.3%, energy costs serve as a key input for inflation metrics. A sustained decline in oil prices may lower inflationary pressures, potentially providing the Fed with more flexibility regarding the current 3.64% Fed Funds Rate.
This market commentary is for informational use only. The views expressed are those of the author and do not constitute financial, investment, or trading advice.
📊 Data Sources
yfinance · FRED (St. Louis Fed) · SEC EDGAR · Finnhub · World Bank · Wikidata
Last Updated: 2026-04-17 16:08 KST
This analysis uses public data sources. Investment decisions are your own responsibility.
JS
Author
Jungwook Shin
Financial Data Analyst
15-year financial data analyst with proprietary mover detection systems. Real-time catalyst analysis across US, Korea, and Japan markets.
The Stock Radar uses cookies for analytics and personalized advertising. By continuing to use our site, you accept the use of these cookies. See our Cookie Policy and Privacy Policy.