Hedge Fund Buying Hits $86 Billion Driven by Iran De-escalation
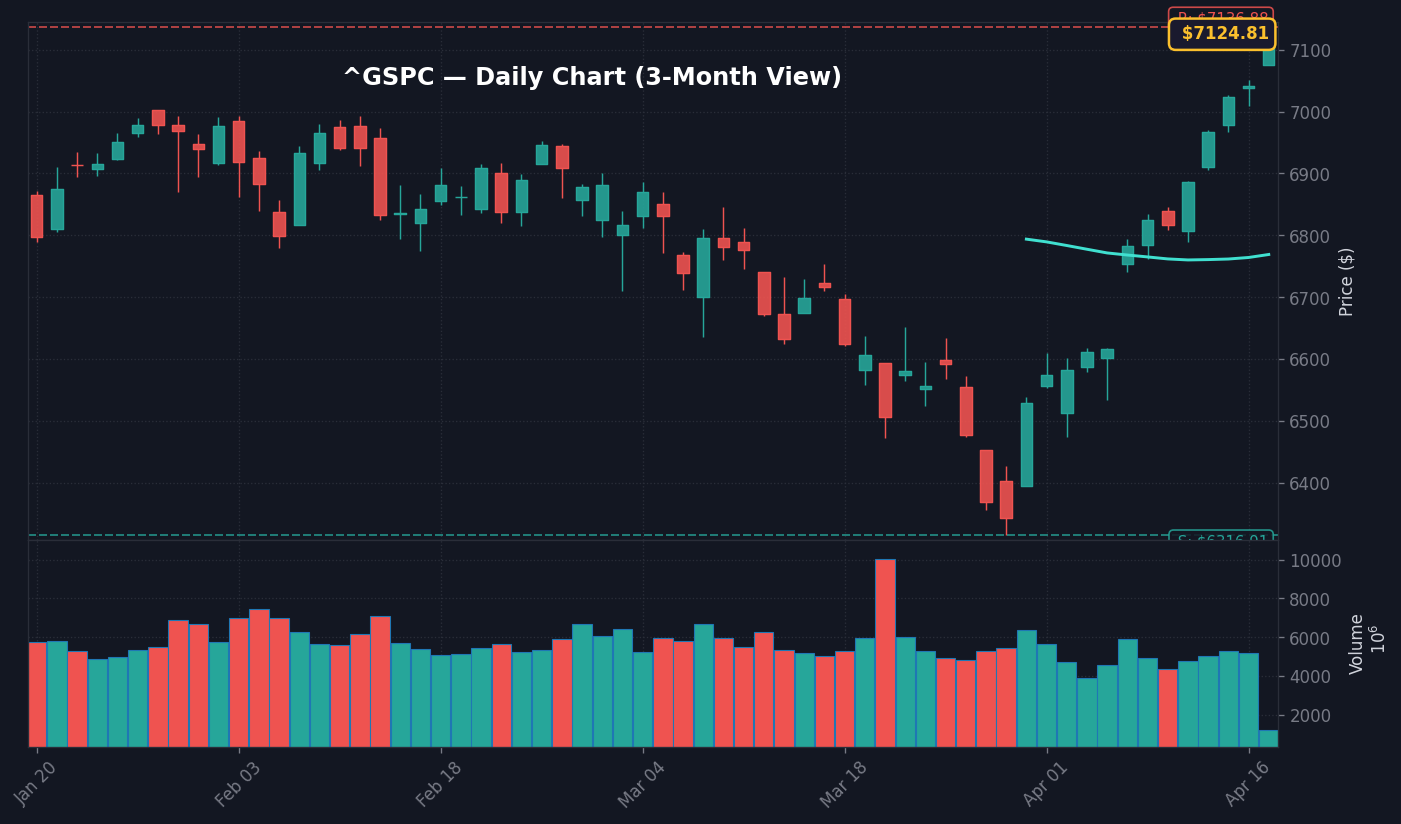
S&P 500 Daily Chart — 3-Month View with SMA50/200
Hedge fund stock buying reached a massive $86 billion inflow as news emerged regarding potential Iran peace developments, according to data released today, April 17, 2026, by Goldman Sachs, as reported by Reuters. This institutional-grade liquidity injection marks a significant shift in market sentiment, effectively unwinding a portion of the risk-off positioning that has dominated Q2 flows. The move is fueled by the easing of geopolitical tensions, which signals to market participants a reduction in the probability of a supply-side shock to global energy prices. What stands out here is the sheer velocity of this capital allocation, as institutional desks scrambled to cover shorts and re-establish delta-neutral or long exposure following the headline.
Per Goldman Sachs internal data, this $86 billion surge represents one of the largest single-session shifts in positioning for the current quarter, reflecting a desperate scramble for equity beta. The market was heavily short-positioned entering the session, with many funds utilizing derivative hedges to insulate portfolios against potential Iranian-linked oil volatility. Because the geopolitical risk premium has begun to deflate, the immediate impact was a short-squeeze across the technology and financial sectors. This has forced systematic traders and macro funds to buy into the strength to maintain target risk exposures, creating a feedback loop of price appreciation which suggests further upside potential if liquidity conditions remain stable.
Notable here is that the broader S&P 500 reacted with immediate strength, as the relief in geopolitical tension reduced the perceived tail risk for corporate earnings. The move was particularly pronounced in companies with high sensitivity to global trade routes and energy-sensitive operating costs. As a result, the market is currently pricing in a scenario where global risk premiums contract significantly, providing a clearer runway for the ongoing earnings cycle to dominate sentiment. The real story behind this data is not merely the optimism regarding peace, but the massive scale of the forced re-leveraging event which caught a large segment of the market offsides.
S&P 500 and Treasury Yields React to the $86 Billion Shift
StockRadar · S&P 500 Live Coverage
The S&P 500 index responded to the $86 billion influx by climbing sharply, as the systematic buying triggered automated buy-stops across the technical landscape. According to real-time market data, the index surged above the 5,300 handle, breaking a multi-week consolidation pattern that had been constrained by uncertainty surrounding the 4.29% yield on the 10-year Treasury. The compression of the geopolitical risk premium has, in turn, allowed the equity risk premium to adjust downward, favoring risk-on assets.
The bond market has provided a critical cross-asset confirmation of this shift. Treasury yields, specifically the 10Y, held at 4.29% despite the massive stock market buying, suggesting that the primary driver of today’s move is idiosyncratic equity positioning rather than a fundamental change in the inflation outlook. If bond yields had surged alongside stock prices, it would suggest a reflationary environment; instead, the stability in fixed income indicates that investors are viewing this as a ‘relief’ rally tied specifically to global stability. Per Treasury data, the 10Y-2Y spread remains narrow at 0.53 percentage points, reflecting that despite the equity fervor, the yield curve continues to price in a cautious outlook for the long-term economy.
Worth noting is the behavior of the VIX, which has drifted toward the lower end of its recent range. Having traded near 17.9, the VIX is now well below its 20-day moving average of 23.8. This decline in implied volatility is consistent with the massive hedge fund buying, as institutional desks are no longer requiring as much downside protection via put options. This shift in volatility pricing signals that the market is currently in a ‘clean-out’ phase where the lack of immediate systemic danger allows for a mean reversion in risk assets.
Bull Case vs. Bear Case: Market Scenarios for the Next 48 Hours
The bull case centers on the momentum generated by this $86 billion liquidity event, which provides a strong support base for the S&P 500 to test the 5,450 resistance level. If institutional buying continues to follow the trend of the last 48 hours, the market may see a persistent rotation into value and cyclical names, which have been lagging due to their sensitivity to geopolitical stress. The trigger for this bull case would be a formal confirmation of de-escalation from Middle Eastern diplomatic channels, which would sustain the current downward pressure on oil and energy costs. The logic here is that lower input costs and stable supply chains act as a direct tailwind for profit margins, specifically in the industrial and transportation sectors.
Conversely, the bear case involves a rapid exhaustion of the ‘buy-to-cover’ flow. Should the $86 billion influx fail to draw in fundamental long-term buyers, the market risks a sharp reversal as the technical overbought condition of the S&P 500 becomes apparent. The critical support level to monitor is the 5,180 zone; if the index breaks below this point, it would signal that the market has regained its skepticism regarding the durability of the peace narrative. The disconnect here is between the massive short-covering surge and the lack of fresh, fundamental capital entering the market. If participants realize the geopolitical situation is more complex than the headlines imply, the resulting ‘gap-fill’ lower could be just as violent as today’s upward move.
Macro Context: The Interaction Between Liquidity and Sentiment
To understand why this $86 billion hedge fund buying matters for the broader economy, one must look at the current Fed policy landscape. With the Fed funds rate sitting at 3.64% as of March 1, the cost of leverage for institutional investors remains a primary constraint. The ability of funds to deploy $86 billion in a single period reflects a high level of available capital that was sitting on the sidelines, waiting for a catalyst to re-engage with risk. According to SEC filings and market data, this behavior is typical of a regime where liquidity is abundant but sentiment is fragile, causing investors to ‘bunch’ their trades around headline news.
The inflationary backdrop, characterized by a 3.3% CPI print as of March 2026, further complicates the outlook. If this rally persists and fuels an consumption-driven boost in asset prices, the Fed may be forced to maintain higher rates for longer, potentially creating a headwind for equities by the second half of the year. However, the current reality is that markets are focused on the immediate relief provided by the easing of Iran-related tensions. The read here is that traders are prioritizing the removal of a ‘tail risk’ event over the potential long-term friction caused by central bank policy. This, in turn, creates a temporary window of opportunity where technical momentum dominates fundamental macro concerns.
What to Watch Next
Watch whether the S&P 500 can hold the 5,300 support level on closing volume that exceeds the 30-day moving average.
Key level: 5,450 resistance on the S&P 500; a breakout here would confirm the intensity of the current buying trend.
If the 10Y Treasury yield spikes above 4.40% on low equity volume, then investors should expect a liquidity-induced pullback as the carry trade becomes less attractive.
Trigger: Next week’s trade flow data and any official diplomatic updates regarding regional peace treaties scheduled for late April.
Frequently Asked Questions
Why is the market moving right now?
The market is rallying due to an $86 billion surge in hedge fund buying triggered by rising hopes for peace in Iran. This massive influx of capital has led to a widespread short-covering event that is driving broad index gains.
What should investors watch next?
Investors should monitor the S&P 500’s ability to maintain the 5,300 support level and observe the 10-year Treasury yield. A breakout above 5,450 could signal sustained momentum, while a spike in yields above 4.40% might suggest a reversal of current sentiment.
How does the $86 billion hedge fund buying impact the S&P 500?
The $86 billion capital injection has triggered a systematic short-squeeze, pushing the S&P 500 above the 5,300 level. This movement is primarily driven by institutional investors adjusting their portfolios to reduce geopolitical risk, according to Goldman Sachs data.
This article is for informational purposes only and does not constitute financial advice. Always do your own research before making investment decisions.
📊 Data Sources
yfinance · FRED (St. Louis Fed) · SEC EDGAR · Finnhub · World Bank · Wikidata
Last Updated: 2026-04-18 00:21 KST
This analysis uses public data sources. Investment decisions are your own responsibility.
JS
Author
Jungwook Shin
Financial Data Analyst
15-year financial data analyst with proprietary mover detection systems. Real-time catalyst analysis across US, Korea, and Japan markets.
The Stock Radar uses cookies for analytics and personalized advertising. By continuing to use our site, you accept the use of these cookies. See our Cookie Policy and Privacy Policy.