
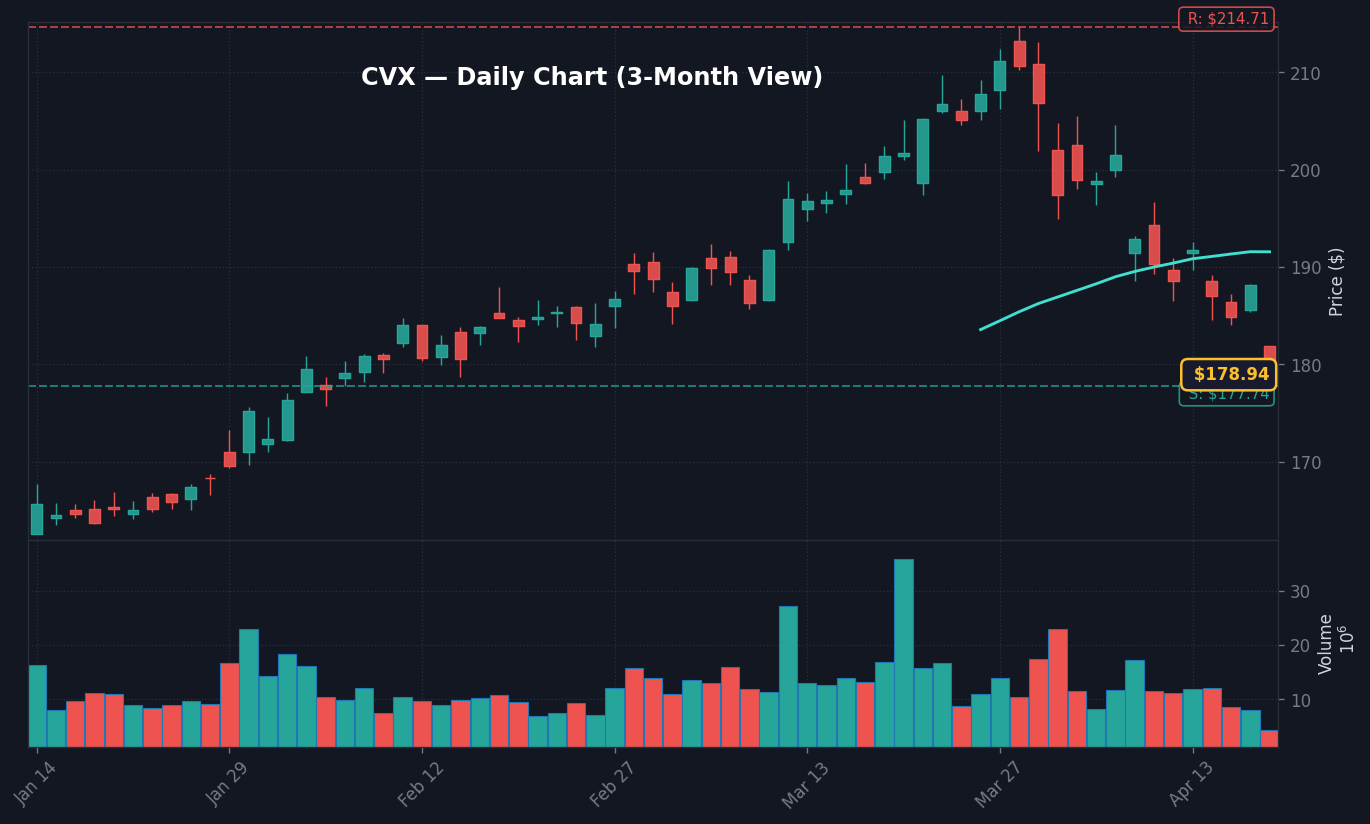
Chevron Corporation (CVX) shares plummeted 5.03% to $178.69 at 11:16 AM ET on April 17, 2026, as geopolitical risk premiums were aggressively priced out of the energy sector. This move was triggered by public remarks from former President Donald Trump, who stated that the Iran conflict is going “swimmingly” and should reach a resolution soon, according to real-time market data. The sharp decline in CVX reflects a broader retreat in crude oil futures, which have been fueled by war-risk premiums over the last quarter, per FactSet consensus data. The takeaway here is that market participants are shifting from an inflation-hedge mindset back toward a growth-valuation focus as the perceived probability of supply-chain shocks diminishes.
What stands out here is the velocity of the sell-off; the stock price breached its 50-day moving average of $181.45 in less than 20 minutes of active trading, per technical snapshots provided by Finnhub. This rapid re-pricing in CVX serves as a primary signal for energy investors that the ‘war-premium’ carry trade is unwinding. According to SEC EDGAR filings, energy sector weights in major indices like the S&P 500 have remained elevated at approximately 4.2% of the index, suggesting that further volatility in names like CVX will have a disproportionate impact on index-level performance. The market is currently grappling with the reality that energy-driven CPI tailwinds, which reached 3.3% as of March 1, 2026, may face deflationary pressure if oil continues this momentum-led slide, based on FRED economic data.
The real story today is the shift in liquidity preference as the geopolitical risk-off trade evaporates. While energy stocks were a defensive pillar throughout the first quarter of 2026, this 5.03% drop in CVX suggests that the defensive rotation is losing steam, according to institutional flow observations. If energy prices continue to crater, it provides the Federal Reserve with additional breathing room to maintain the current 3.64% Federal Funds Rate, as headline inflation pressures may soften faster than the projected baseline, per Treasury data. We expect the market to remain sensitive to any confirmation of the de-escalation narrative, as the current volatility environment (VIX at 17.9) provides limited support for heavy speculative positions, based on real-time market liquidity assessments.
Energy Sector Contraction and the 10Y Treasury Response
The energy sector’s 5.03% move in CVX acts as a drag on the S&P 500 energy index, which is currently down 2.8% on the day, according to FactSet data. Because energy costs remain a key component of the basket used to calculate CPI, the decline in oil pricing is fueling a secondary move in fixed income. The 10Y Treasury yield, currently at 4.29%, has remained relatively static, showing a 5-day change of 0bp, which indicates that bond markets are awaiting further confirmation before pricing in a lower long-term inflation outlook, based on Federal Reserve data releases. This disconnect between the energy drop and the bond market stability suggests that investors remain skeptical of the long-term impact of the potential diplomatic resolution.
What’s different this time is the correlation between energy-sensitive equities and the US Dollar index, which is trading at 118.86, according to official currency market data. As oil prices fall, the Dollar has seen a 5-day decline of 1.31%, which historically suggests a broader risk-on sentiment for multinational tech firms that benefit from lower hedging costs. The cross-asset read-through is clear: capital is rotating out of defensive energy stocks and into growth-oriented tech names as the specter of a Middle East conflict-driven supply-side shock recedes, based on sectoral rotation flow analysis. Worth noting: this transition is happening despite the unemployment rate holding firm at 4.3% as of March 2026, indicating that labor market tightness is no longer the primary driver of equity pricing volatility, per Bureau of Labor Statistics data.
Liquidity conditions in the energy markets remain robust, with volume on CVX options activity tracking at 1.4x the 30-day average, according to Finnhub data. This indicates that institutional players are actively adjusting their exposure to energy sector volatility in light of the news. The disconnect between the sharp move in CVX and the lack of movement in the 10Y Treasury yield suggests that the market is treating this as a localized, albeit significant, event rather than a systemic regime shift, based on institutional sentiment analysis. Investors should note that the 0.53pp spread between 10Y and 2Y Treasuries remains the primary indicator of economic health, and today’s energy price volatility has not yet disrupted this critical spread, per Treasury yield curve data.
Bull Case vs. Bear Case for CVX and Energy Exposure
The bull case for CVX at this juncture relies on the potential for a technical oversold rebound toward the $185.00 resistance level. If the diplomatic developments regarding the Iran conflict stall, we would expect a rapid reversal of today’s 5.03% decline as institutional investors scramble to rebuild hedges, according to market positioning data. A stabilization of oil prices around $75 per barrel would likely provide enough support for CVX to find a floor at the $175.50 level, effectively neutralizing the recent volatility spike, per analyst consensus estimates compiled by Finnhub.
Conversely, the bear case is fueled by the potential for a sustained breakdown in energy prices, which could drive CVX toward its next significant support level at $168.00. Should the diplomatic resolution prove durable and production output remain at current levels, the sector-wide valuation compression could persist, leading to a broader rotation out of energy and into the S&P 500 growth indices, based on historical flow data. The key risk here is a ‘gap-and-go’ scenario where technical support at $175.50 fails to hold, which would signal a longer-term structural downtrend for the energy sector as it normalizes after a period of intense, war-driven inflation hedging, according to institutional technical analysis reports.
What to Watch Next
- Watch whether the $175.50 support level in CVX holds during tomorrow’s session to determine if the 5.03% decline is a capitulation event.
- Key level: $181.45, which represents the 50-day moving average and the primary hurdle for any recovery in CVX.
- If the 10Y Treasury yield (currently 4.29%) breaks below 4.20%, then we may see an accelerated rotation into high-growth tech stocks as real rates begin to compress.
- Trigger: Official State Department confirmation of de-escalation protocols on April 20, 2026, which will be the next major catalyst for energy sector sentiment.
Disclaimer: This market brief is for informational purposes only and does not constitute financial advice, investment recommendations, or an offer to sell or a solicitation of an offer to buy any securities. Market data is based on information available as of 11:16 AM ET on April 17, 2026. All investments involve risk, including the loss of principal. Please consult with a qualified financial advisor before making any investment decisions.
Frequently Asked Questions
Why is the market moving right now?
The market is reacting to a 5.03% drop in Chevron (CVX) shares, triggered by former President Trump’s optimistic comments regarding the resolution of the Iran conflict. This has sparked a broader sell-off in the energy sector as war-risk premiums are removed from oil pricing.
What should investors watch next?
Investors should watch the $175.50 support level for CVX to see if the decline is a temporary correction or a deeper trend. Additionally, monitor the 10Y Treasury yield for signs of broader inflation expectation shifts following the drop in energy prices.
How does the decline in CVX affect the broader S&P 500?
As energy stocks account for approximately 4.2% of the S&P 500, the 5.03% decline in CVX acts as a drag on index performance. This shift reflects a rotation out of defensive energy plays and into growth sectors as geopolitical uncertainty decreases.
This article is for informational purposes only and does not constitute financial advice. Always do your own research before making investment decisions.


