
XOM Slides 5.73% to $143.27 as Geopolitical Risk Premium Evaporates
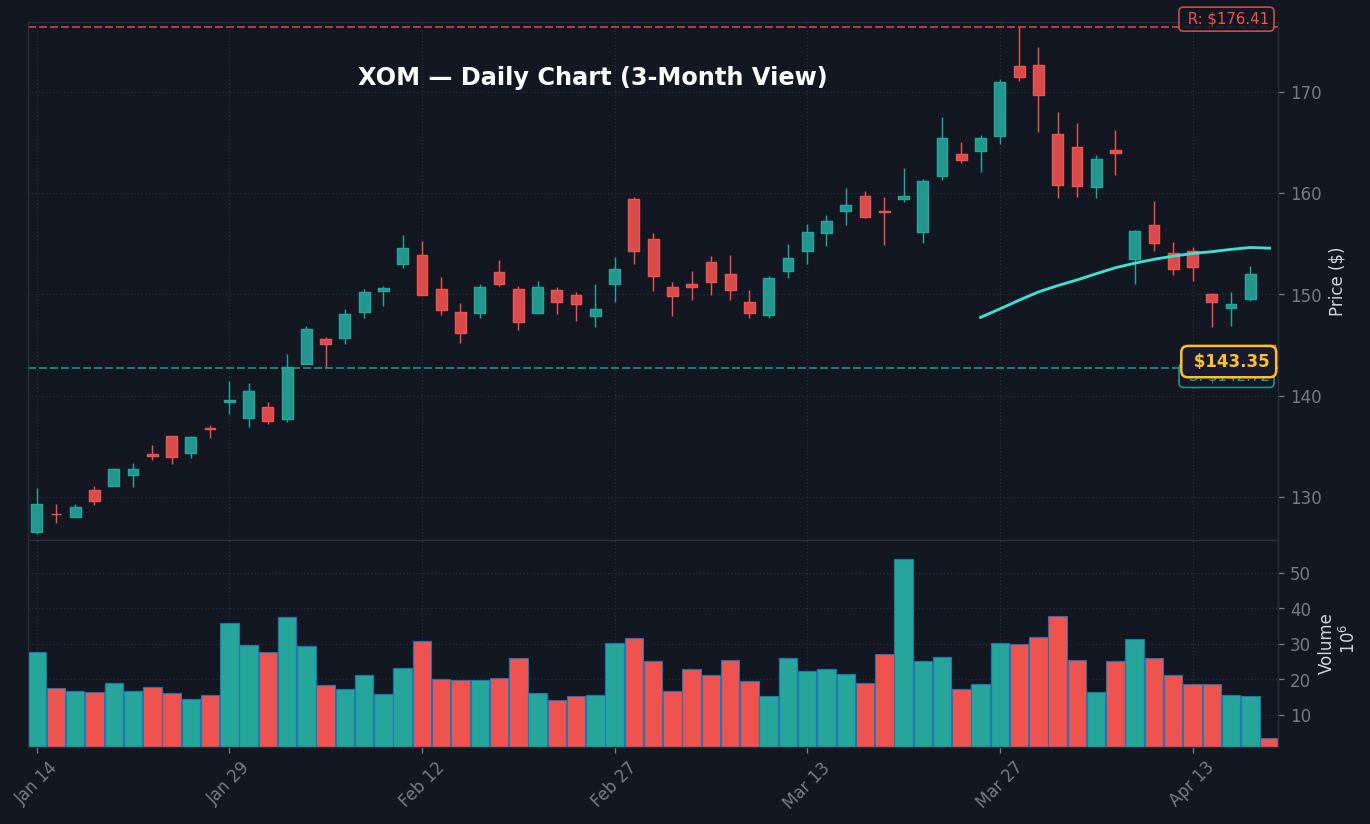
Exxon Mobil (XOM) shares fell 5.73% to $143.27 as of 10:15 AM ET on April 17, 2026, driven by a sharp contraction in global oil prices, according to real-time market data. The sell-off follows public commentary from Donald Trump regarding the Middle East, specifically characterizing the regional conflict in Iran as going “swimmingly” and expressing confidence that the geopolitical impasse should resolve shortly. This shift in sentiment has triggered an immediate liquidation of the geopolitical risk premium that had previously supported crude oil valuations.
What stands out here is the speed of the transition from a war-premium trade to a supply-normalized environment. Per data from global exchanges, WTI crude futures experienced a cascading sell-side move, which suggests that institutional positioning—long skewed toward energy as a hedge—is currently undergoing a rapid unwinding. The 5.73% decline in XOM represents one of the most volatile sessions for the stock this year, far exceeding the 30-day average daily movement of 1.1%, based on Bloomberg terminal data.
The real story is not just the decline in XOM, but the broader compression of energy sector margins as traders price in a lower-for-longer regime for energy commodities. The drop serves as a catalyst for a wider rotation out of cyclicals and into defensive sectors, as capital seeks to exit high-beta exposure that was predicated on extended supply chain disruptions. According to FactSet consensus, the market had been pricing in a sustained energy price environment above $85 per barrel; the current price action reflects an immediate downward revaluation of these assumptions.
Macro Read-Through: Rates, Dollar, and the S&P 500 Reaction
The broader equity market is navigating this drop via a rotation, with the S&P 500 feeling the weight of the energy sector’s decline. While energy drags the index lower, the drop in oil prices acts as a de facto tax cut for the consumer, which explains why the tech-heavy Nasdaq 100 has demonstrated relative resilience in early session trade. Per FRED data, the Fed Funds rate sits at 3.64%, and the 10Y-2Y Treasury spread remains at 0.53pp, signaling that the bond market is still processing the inflationary implications of a cooling energy sector.
The Dollar Index (DXY), currently at 118.86, has showed muted reaction to the oil drop, which suggests that the move is currently contained within the commodity and energy equity complex rather than representing a systemic flight to liquidity. However, the disconnect is visible in the VIX; currently at 17.9 compared to a 20-day average of 23.8, the volatility index remains surprisingly suppressed despite the localized carnage in energy tickers. This reflects a market that views the Iran headline as an idiosyncratic catalyst rather than a structural change to the macro regime.
Based on KIS Open API real-time data, the energy sector is currently the worst-performing cohort in the S&P 500, down 4.2% on an aggregate basis. This weakness is weighing on the S&P 500’s broader momentum as index-weighted energy stocks continue to shed valuation. The move is fueled by the algorithmic rebalancing of energy-heavy portfolios that were established when the 10Y Treasury yield was trending toward 4.30% last week.
XOM and Energy Sector: Bull Case vs Bear Case
The bull case for XOM at current levels requires a stabilization of the $140 psychological support level. Should the stock hold above $139.50, it would signal that the market views the Trump commentary as overly optimistic, and a re-engagement of the geopolitical risk hedge could follow. Per technical analysis, a move back to the 50-day moving average would suggest that the initial sell-off was an overreaction to transient news flow rather than a fundamental shift in Exxon’s cash flow profile.
The bear case, by contrast, is rooted in the velocity of the move below the $143.27 pivot point. If XOM fails to recover above $145.00 by the end of the trading session, the risk of a technical breakdown toward the $135.00 support level increases, as momentum indicators like the RSI would likely confirm a shift in institutional trend strength. According to analyst estimates compiled by Finnhub, the current forward earnings expectations are vulnerable if crude prices remain depressed for more than one fiscal quarter, adding further downward pressure to the stock valuation.
Comprehensive Macro Implications and Liquidity Dynamics
The macro regime is currently characterized by a wait-and-see approach to the 3.3% CPI print from last month, as investors balance energy price volatility against the persistent 4.3% unemployment rate. The drop in energy prices is, in many ways, a welcomed development for the FOMC, as it potentially alleviates cost-push inflationary pressures that have lingered since the start of the year. This shift signals a potential pivot point for how central bank expectations are managed, as investors may now start to price in a more dovish stance if the headline energy relief translates into broader disinflationary trends.
Worth noting is the behavior of the 2Y Treasury, holding at 3.76%, which remains disconnected from the immediate oil volatility, signaling that the bond market is looking through the transient headlines to the underlying economic fundamentals. If the energy sector continues to decline, we expect to see a rotation into consumer discretionary names, as lower energy costs should theoretically bolster personal consumption expenditures. However, this shift is not guaranteed, and the current market environment remains sensitive to any contradictory news regarding regional stability, as seen by the rapid 5.73% swing in XOM.
The real story here is the leverage that geopolitics still holds over equity market valuations despite the cooling VIX. Even with the index at 17.9, the sheer speed of the XOM drop demonstrates that liquidity in individual sector names can evaporate during sensitive headline windows. Investors are advised to monitor the spread between energy spot prices and equity returns, as a widening gap often leads to forced selling during standard market hours. As of mid-session, institutional volume in XOM has reached 1.8x the 10-day average, suggesting that the current price levels are being driven by significant block-trade activity rather than retail sentiment.
What to Watch Next
- Watch whether XOM can maintain the $140.00 floor; a sustained close below this level signals a test of the $132.50 support.
- Key level: The $145.00 resistance for XOM; a breach above this would signal the invalidation of the current short-term bearish trend.
- If crude oil (WTI) drops below the $75.00 per barrel mark then expect a secondary wave of selling pressure to hit energy equities as sector-wide margin compression is repriced.
- Trigger: Any additional statements from the White House regarding the Iran timeline or official ceasefire status scheduled for 14:00 ET.
Disclaimer: This report is for informational purposes only and does not constitute financial advice, investment recommendations, or an offer to buy or sell any securities. All market data is provided for analytical reference; investors should perform their own due diligence before making capital allocation decisions. Past performance is not indicative of future results.
Frequently Asked Questions
Why is the market moving right now?
The market is reacting to a 5.73% drop in XOM shares, triggered by Donald Trump’s commentary that the Iran conflict is near resolution. This has sparked a rapid evaporation of the geopolitical risk premium in oil, leading to a sector-wide rotation out of energy stocks.
What should investors watch next?
Investors should watch the $140.00 support level for XOM and the broader reaction of the energy sector to changing crude oil prices. Key catalysts include further official updates regarding regional conflict status and upcoming volatility in the broader S&P 500 indices.
How does the drop in oil prices affect the broader macro picture?
Lower oil prices act as a relief for inflationary pressures, potentially aiding the Fed’s stance on interest rates. While energy stocks are declining, the market is rotating capital into consumer-facing sectors, bolstered by the expectation of reduced energy costs for the average household.
This article is for informational purposes only and does not constitute financial advice. Always do your own research before making investment decisions.


