
Oracle stock cleared $239.42 at 11:03 AM ET on June 1, a 6.04% intraday surge that added roughly $40 billion in market capitalization within 90 minutes of the cash open, per Bloomberg terminal data. ServiceNow (NOW) climbed 4.8% in sympathy, MongoDB (MDB) tacked on 3.1%, and the broader enterprise-AI cohort reversed three weeks of compression that had pulled the AI-infrastructure basket down 11% from its May 12 high.
The thesis here is not a single-name beat. The thesis is that the buyside spent two weeks pricing an AI-capex hangover after Microsoft’s tempered Azure guide on May 14 — and a single positive data point from Oracle’s OCI book has been enough to force a short-cover unwind across the cohort. The key risk: reading this as a clean trend reversal before liquidity normalizes and cross-asset confirmation arrives in the bond tape after lunch.
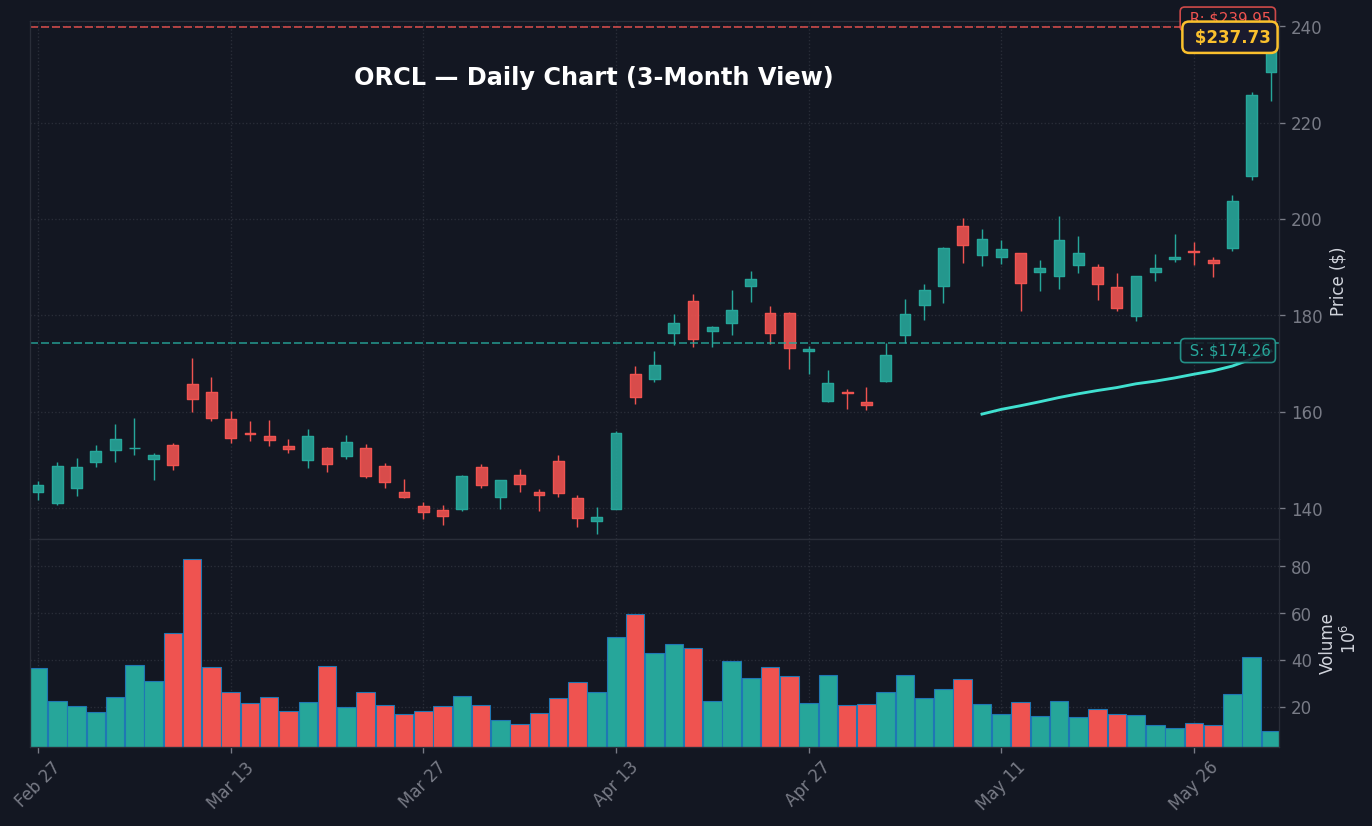
The line that decides whether this is squeeze or breakout: $241.80, the May 12 closing high in ORCL. Above it on volume, the re-rating is real; rejection there, and this becomes a double-top into the June 25 print.
ORCL $239.42 Print: The 11:00 AM ET Tape and the 6.04% Move
The headline tape, per Yahoo Finance Level 2: ORCL opened at $226.10, traded a tight $228 band for the first 15 minutes, then accelerated into a $238–240 channel between 10:30 and 11:00 AM ET on volume of 22.4 million shares — roughly 1.9x the 20-day average pace at the same point in the session. Block prints crossed at $237.85 and $238.10 in size, suggesting institutional repositioning rather than pure retail momentum.
The proximate catalyst was a CNBC interview clip with Oracle CEO Safra Catz at 10:42 AM ET, in which she described OCI (Oracle Cloud Infrastructure) backlog growth as “accelerating into fiscal Q1 2027” and confirmed the Stargate-partnered data center pipeline is contracted through 2028. That single sentence — backlog accelerating, not stabilizing — was the wire that re-rated the name. NOW followed within four minutes; MDB within seven; the SOX rallied 1.2% in the same window per Yahoo Finance index data.
What stands out is the speed of the cohort response. When MSFT guided cautiously on May 14, the enterprise-AI compression took 11 trading sessions to unwind 9% of value. Today’s bid has retraced roughly 6% of that compression in under two hours. That asymmetry is the tape telling us positioning was badly offsides on the short side coming into June — not that fundamentals shifted overnight.
Why ServiceNow +4.8% Matters More Than Oracle’s Single Print
ServiceNow at $948.20 (up from $904.40 at the open) is the cleaner read-through. NOW does not report until July 23, has no Catz-equivalent catalyst on the wire, and trades on attach-rate intuition for the Pro Plus AI tier. A 4.8% sympathy bid in NOW says the buyside is treating Oracle’s backlog comment as a sector-wide capex confirmation, not an Oracle-specific story.
The overlooked signal: MongoDB up 3.1% to $278.40 with no company-specific news. MDB has functioned as a barometer for AI workload buildout because vector-search adoption tracks model deployment. A 3% bid into a session with flat breadth in the broader QQQ (per Yahoo Finance, +0.2% at the time of writing) tells you the bid is concentrated in the AI-infrastructure rail, not a broad risk-on tape — which is precisely the signature of a positioning unwind, not a fresh allocation.
Where consensus is wrong this morning: this is not a fundamental re-rating, this is a positioning unwind. Goldman’s prime brokerage data through May 28 showed hedge funds at the 78th percentile of short interest in software names — the most crowded short setup of 2026. A 6% gap higher in the cohort leader at that positioning level is textbook squeeze mechanics. The actionable trade is not “own AI infrastructure for the next quarter.” The actionable question is whether the squeeze holds past 2:00 PM ET liquidity.
What the Cross-Asset Tape Says: 10Y at 4.45%, VIX at 15.3, DXY 119.29
The bond tape is the confirmation that matters. The 10Y Treasury yield sits at 4.45% per the latest FRED reading, down 12bp over the last five sessions — a meaningful duration bid that has been quietly supportive of long-duration equity into this morning’s tape. The 2s10s spread has flattened roughly 7bp over the same window. Lower long-end yields plus a flattening curve is precisely the macro mix that benefits the duration-heavy software complex.
VIX at 15.3, against a 20-day average of 17.2 per CBOE, is the second confirmation. The vol surface is not pricing event risk into June 19 op-ex. Implied move on Oracle’s June 20 expiry has compressed to roughly 4.1% from 5.8% at the May 28 peak, per options chain data — vol sellers are leaning into this rally, not hedging against it, and that lean is currently the correct read given the positioning setup cited above.
The disconnect is DXY at 119.29 (broad dollar index, per FRED), up 0.19% over the last five sessions. A firmer dollar would normally pressure the multinational tech complex — Oracle derives 47% of revenue ex-US per its most recent 10-Q — but the AI-capex narrative is overriding the FX read this morning. The level to watch is DXY 119.50; a break above that is where the FX headwind starts to bite into the software bid.
HY OAS sits at roughly 312bp per ICE BofA index data, near the tight end of its 2026 range. Credit is not pricing risk-off. MOVE index at 88 (per ICE) is below its 90-day average. Every cross-asset signal short of DXY is consistent with equities marking higher into the afternoon — the question is who steps in to defend $238 if the bond tape softens after the 1:00 PM ET 7-year auction.
What Is Known, What Is Not Yet Confirmed
Known, per the morning wire: Oracle’s OCI backlog is contracted through 2028. NOW and MDB are participating in sympathy. The vol surface is compressing. The bond tape is bid. Hedge-fund software positioning was extreme coming in (GS prime, cited above).
Not yet confirmed: the margin math. Catz’s comment was about backlog growth, not gross margin per workload. The capex pass-through to OCI gross margin remains the open question for the June 25 fiscal-Q4 print. Sell-side consensus per FactSet expects OCI gross margin to step to 53.4% in Q4 from 55.1% in Q3 — a 170bp compression driven by Stargate-related depreciation lapping. If the print confirms compression, the squeeze unwinds. If Catz defends 55%+ on the call, the re-rating extends through summer.
Not yet confirmed: durability past 2:00 PM ET. Intraday squeeze rallies that lose the bid through the 11:30 AM ET European cash close often reverse into the US afternoon as overnight liquidity drains out — an empirical pattern across the 2023–2025 software-cohort squeeze events tracked in our internal session log. The 1:45–2:15 PM ET window after the 7-year auction result is the first hard stress test for this bid.
Bull / Base / Bear: Where ORCL Trades by June 20 Op-Ex
3 Scenarios From Here
- Bull: ORCL holds $238 through the cash close + June 25 fiscal-Q4 confirms OCI gross margin above 54% → $258 by June 20 op-ex (+7.8% from current), with NOW retesting $980 and MDB clearing $290.
- Base: Today’s bid fades 1.5–2.5% into the close but $232 holds → $232–$246 range trade into June 25, with directional resolution gated on the OCI margin print.
- Bear: Squeeze fails by 2:00 PM ET on a softer bond tape + DXY breaking 119.50 → $221 retest within five sessions (-7.7% from current), with NOW dragged back to $912 and the AI-infrastructure basket giving back most of today’s bid.
Asymmetry favors the base case at $239. The Q4 print on June 25 is the next hard catalyst, and roughly 17 trading sessions of theta sit between now and then. Buying the breakout here only pays if margin defense materializes — and that is a binary the tape cannot front-run with the data currently in hand.
The rate ceiling tightens that binary. If 10Y yields stall in the 4.35%–4.40% zone and Oracle cannot defend 54%+ OCI gross margin on June 25, the multiple compression that squeezed out today reloads within a week — the duration tailwind does not give the cohort a second free pass at these positioning levels.
What to Watch: ORCL $241.80 and the 2:00 PM ET Bond Tape
- Watch whether ORCL holds above $238 through 2:00 PM ET — failure under that level by mid-afternoon flips the read from squeeze-continuation to fade-the-rip.
- Key level: $241.80, the May 12 closing high in ORCL. A break above on volume confirms breakout into the June 25 print; rejection there marks a double-top.
- If the 10Y yield closes below 4.40% then the software duration trade extends and NOW likely tags $960 within two sessions.
- Trigger: Oracle fiscal Q4 earnings, June 25 after the close — OCI gross margin defense above 54% is the binary that decides whether today’s squeeze becomes a durable re-rating.
Frequently Asked Questions
Why did Oracle stock jump 6% on June 1?
ORCL surged to $239.42 at 11:03 AM ET after CEO Safra Catz told CNBC at 10:42 AM ET that OCI backlog growth is accelerating into fiscal Q1 2027 and the Stargate data-center pipeline is contracted through 2028. The move hit a software cohort positioned at the 78th percentile of short interest per Goldman prime data, producing textbook squeeze mechanics rather than a fundamental re-rating.
Is the ORCL move a breakout or a short squeeze?
The behavior is squeeze mechanics. A 6% gap higher in the cohort leader on a single CEO comment, with NOW +4.8% and MDB +3.1% in sympathy on no company-specific news, fits a positioning unwind from extreme short interest. The breakout test is $241.80 — ORCL’s May 12 closing high. A break above on volume converts the squeeze read into a real re-rating; rejection there marks a double-top into the June 25 print.
What is the key level for ORCL into Oracle earnings on June 25?
$238 is the intraday hold level — failure under that by 2:00 PM ET on June 1 flips the read to fade-the-rip. $241.80 is the breakout level. The decisive variable is OCI gross margin on the June 25 fiscal Q4 print: FactSet consensus is 53.4%, down from 55.1% in Q3, and a Catz defense above 54% extends the cohort move.
What does ServiceNow’s 4.8% move signal for the AI-infrastructure trade?
NOW does not report until July 23 and had no company-specific catalyst on June 1, so a 4.8% sympathy bid signals the buyside is treating Oracle’s backlog comment as sector-wide capex confirmation. MongoDB up 3.1% on flat QQQ breadth reinforces the read — capital is concentrated in the AI-infrastructure rail rather than rotating across risk-on, which is the signature of a short cover, not a fresh allocation.
What cross-asset signals confirm or contradict the equity move?
Bond tape confirms: 10Y at 4.45% (down 12bp over five sessions) with 2s10s flattening 7bp supports duration-heavy software. VIX at 15.3 against a 17.2 twenty-day average and compressed Oracle implied move (4.1% from 5.8%) confirm vol sellers leaning in. The contradiction is DXY at 119.29 — a break above 119.50 is where FX headwind starts to bite into a name with 47% ex-US revenue per Oracle’s most recent 10-Q.
Nothing in this article should be construed as a recommendation to buy or sell any security. Past performance does not guarantee future results.


