
The S&P 500’s -0.11% open at 7,571.64 is a distraction — 9 of 11 sectors are red, VIX just popped 4.57% to 16.02, and the only two green sectors are Energy (+1.33%) and Technology (+0.73%). Front-month S&P futures sit at 7,584.0, a 13-point premium to cash per the 09:33 ET tape, which says programmatic dealers are still leaning long even as the Dow lags at -0.41% (50,822.97) and the Nasdaq Composite holds -0.04% (26,962.93). The factor split between the three indices is the entire morning’s story.
Thesis: this is a real-yield-proxy rotation — long inflation pass-through (crude) and long near-zero-duration earnings (AI capex), short anything with input-cost exposure or rate sensitivity. With Industrials -1.07%, Materials -1.14%, Consumer Discretionary -1.42%, and Utilities -1.31% all red while Energy and Tech absorb the bid, the bond market is doing the sector allocation. The 10Y at 4.47% (+2bp per the morning tape) is the variable forcing the rotation; the equity tape is reacting, not leading.
Key risk: the first 30 minutes of a Monday at the start of a new month routinely produces a head-fake. The VIX move from 15.32 to 16.02 is meaningful but not yet confirmation of a stress regime — cross-asset stress would require the 10Y to break 4.55% on volume, and it hasn’t. Don’t extrapolate a -0.11% open into a thesis until liquidity arrives at 10:00 ET with the JOLTS print and ISM Manufacturing release.
Energy +1.33% and Crude’s Tape Tell on June 1
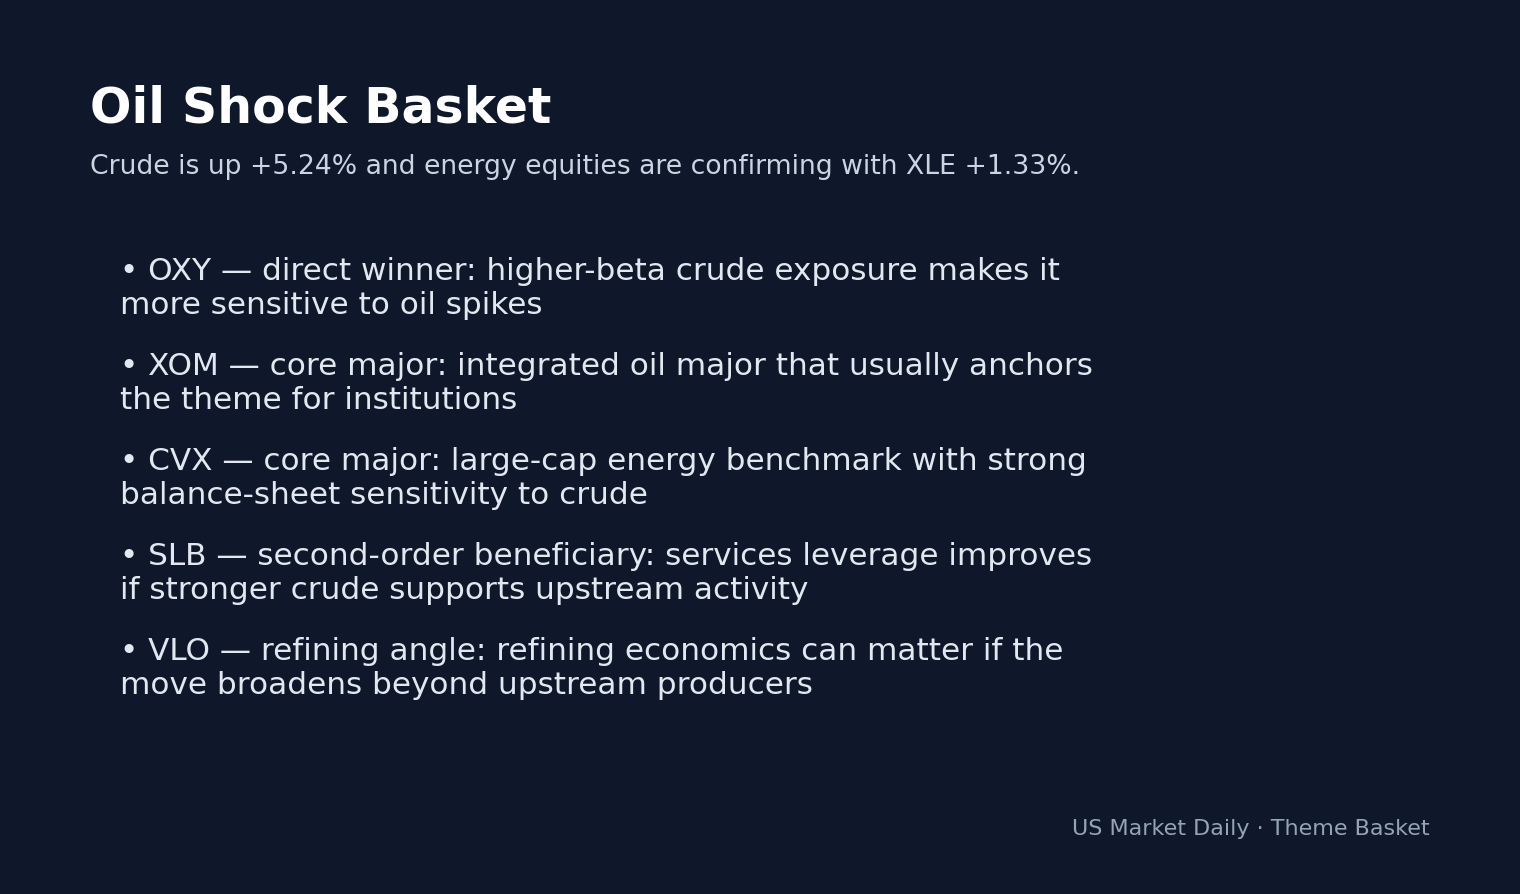
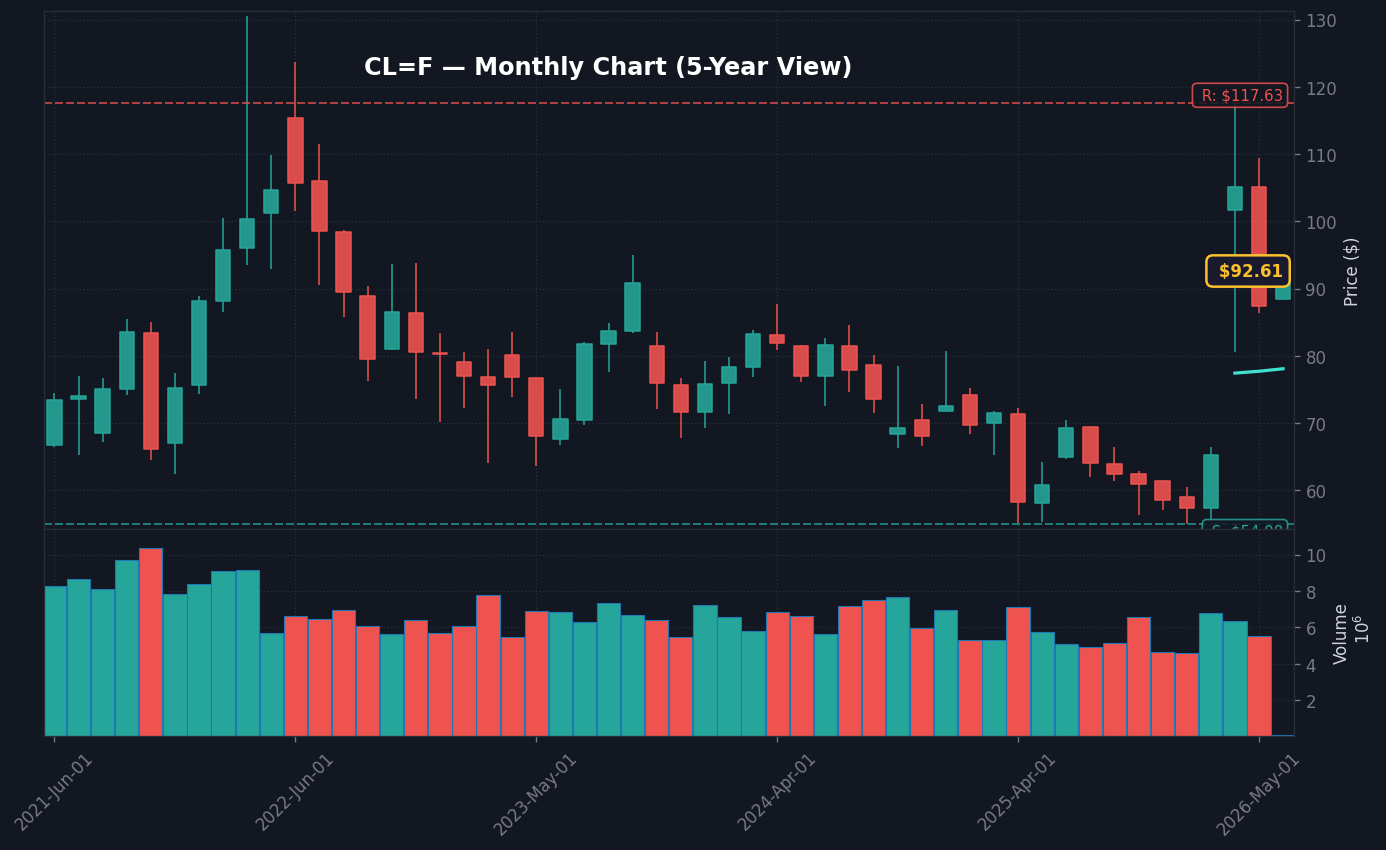
Energy is the only sector up more than 1% and it’s not subtle. WTI’s pop into the open has lifted the sector by 1.33%, with refiners and integrated majors leading. The cleaner signal sits in large-cap services and integrated names: FTI at $68.92 (+0.77%) holding bid while the sector outperforms by 144bp tells you institutional flow is reaching beyond the levered E&P names. The 321 crack spread and XLE options skew are the credible read-throughs to watch — sub-$5 micro-cap E&P moves on the same tape are speculative froth, not signal.
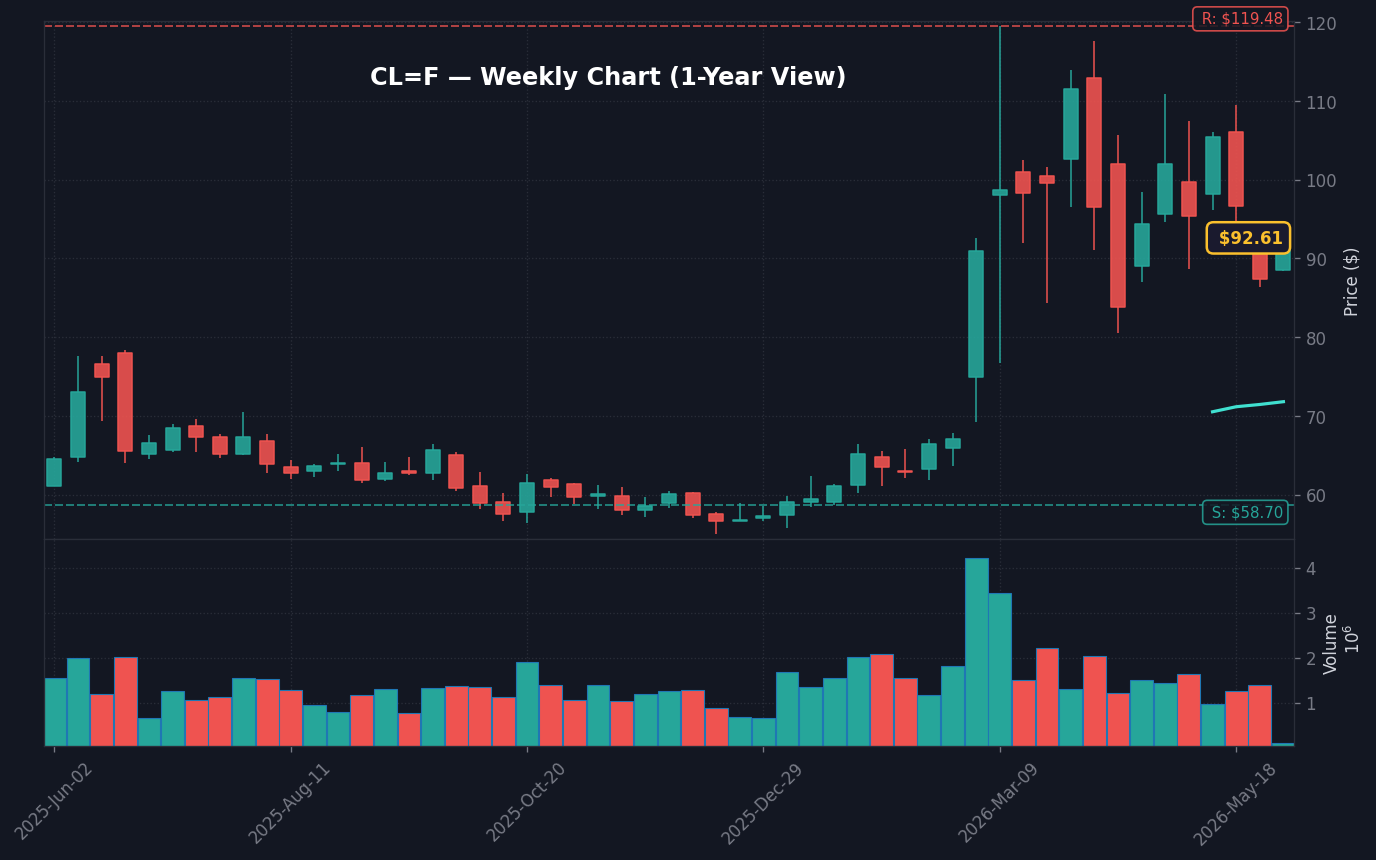
The Energy bid matters because it explains why Industrials (-1.07%) and Materials (-1.14%) are simultaneously down. The market is paying a premium for upstream cash flow and selling downstream input-cost exposure — exactly the trade that gets put on when traders expect crude to grind higher into the EIA weekly inventory print due Wednesday. Large-cap services holding bid while small-cap E&P spikes is a healthier internal than the inverse would be.
What the overlooked names are saying
BTU +2.13% to $27.64 (coal), AMR +6.06% to $210.44 (metallurgical coal), and KOS +4.46% to $2.92 (deep-water E&P) are all bid. That is a basket telling you the energy move is broader than just crude — thermal coal, met coal, and offshore are not the same trade, and when they move together, the underlying is global energy-demand pricing, not a single inventory print. The 5-day Energy sector flow into XLE/XOP supports a multi-day accumulation read, not a Monday-only rebound — that is what makes today’s bid more durable than a typical bounce sector.
VIX 16.02 (+4.57%) and the Volatility-Of-Volatility Setup

The VIX printing 16.02 with a 4.57% daily gain while the S&P is only -0.11% is a non-trivial data point. Implied vol expanding meaningfully faster than realized vol on a flat tape is what the volatility desks call a vol-of-vol bid, and it is usually a leading indicator that hedging demand is outrunning spot. The session high on VIX so far is 16.02 according to the live tape; if it breaks 16.50 before 10:30 ET, that’s the level where systematic vol-control funds begin de-grossing equity exposure mechanically.
The S&P 500 technicals add color: RSI(14) at 65.77 is neutral but tilted toward overbought, the MACD line at 124.06 has crossed below its signal line at 126.89 (a fresh negative MACD divergence per the indicator tape), and price sits inside the Bollinger Band with the 50-day SMA at 7,077.43 still well below spot. The 50-day support is 494 points below the open — too far to act as a near-term floor. The actionable level is 7,540, the prior-day low pivot; a break of 7,540 on volume would confirm that the VIX move is more than dealer-hedge noise.
Megacap Split: NVDA +2.79%, AMD -3.78%, AAPL -0.83% on Jun 1
The Mag 7 tape is splitting in a way that explains the Nasdaq’s outperformance versus the Dow. NVDA is +2.79% to $217.04, while AMD is -3.78% to $496.57 — that’s a 6.5-point intraday spread between the two largest AI-accelerator names on a day with no chip-specific catalyst. The simplest read is positioning: NVDA absorbed institutional inflows last week on data-center capex commentary from hyperscalers, and AMD is giving back the post-earnings momentum trade. MU at $1,020.36 (+5.08%) confirms the memory-spend thesis is alive; ARM at $383.03 (+8.42%) reinforces it on the IP side.
AAPL at $309.46 (-0.83%) and AMZN at $264.13 (-2.41%) are the soft spots, and they explain Consumer Discretionary -1.42%. GOOG -1.20% at $371.91 is dragging Communication Services to -0.05%. The asymmetry inside megacap — AI-capex winners bid, consumer-platform names offered — is the cleanest tell of the morning that the rotation is regime-driven, not headline-driven.
HOOD -7.49% and the risk-off micro signal
HOOD trading -7.49% to $87.24 is the single most important small/mid-cap signal on the screen. Retail-broker beta typically leads index direction by 1-2 sessions when momentum unwinds; HOOD down 7% with the S&P down 0.11% is the exact divergence that preceded the early-May correction. Pair that with MSTR -9.01% at $144.75 (bitcoin proxy) and IREN -4.97% (crypto-mining), and the highest-beta corners of retail flow are de-grossing while the index hangs on.
What Changes Next: JOLTS, ISM Manufacturing, and the 10Y at 4.50%
The next hard catalyst is the 10:00 ET data drop — JOLTS job openings and ISM Manufacturing PMI. Per the standard BLS release schedule, both print at the same minute, and the bond market will react first. The 10Y at 4.47% is 3bp below the 4.50% line that traders are watching as the next break level; a JOLTS print above 8.0M openings combined with ISM Manufacturing above 50.0 would likely push the 10Y through 4.50% and force another leg of duration selling into the Utilities and Real Estate complex.
The base case is a hot JOLTS print — May labor data has beaten consensus 4 of the last 6 months per BLS release history, and last week’s ADP miss was idiosyncratic to one sector rather than a broad slowdown signal. Assign 60% probability to the bear scenario below. Position for a 7,540 test by midday unless ISM manufacturing breaks below 48.5, which would invalidate the hot-data lean and force the rotation back into duration.
3 Scenarios From the 10:00 ET Data Drop
- Bull (20%): JOLTS below 7.7M + ISM Manufacturing below 49.0 → 10Y back below 4.42%, VIX fades to 15.20, S&P closes +0.4% near 7,600 by 16:00 ET.
- Base (20%): JOLTS 7.7-8.0M + ISM 49.5-50.5 → 10Y stays in 4.45-4.50% range, S&P 500 trades 7,545-7,585 channel, VIX 15.80-16.40, no resolution intraday.
- Bear (60%): JOLTS above 8.0M + ISM above 51.0 → 10Y breaks 4.50%, VIX through 16.80, S&P tests 7,540 support, closes -1.0% near 7,495.
What to Watch: 10:00 ET JOLTS Print and S&P 7,540 Pivot
- Watch whether VIX holds above 16.50 through 10:30 ET — that’s the systematic vol-control de-grossing trigger.
- Key level: S&P 500 7,540, the prior-day low pivot — a break on volume confirms the rotation broadens beyond Energy and Tech.
- If JOLTS prints above 8.0M and ISM Manufacturing above 51.0 then the 10Y breaks 4.50% and Utilities/Real Estate take a second leg lower into the close.
- Trigger: JOLTS job openings + ISM Manufacturing PMI, Monday Jun 1 at 10:00 ET; EIA weekly crude inventory print, Wednesday 10:30 ET.
Frequently Asked Questions
Why is the S&P 500 down only 0.11% if 9 of 11 sectors are red on Jun 1?
The cap-weighted index is held up by Energy (+1.33%) and Technology (+0.73%), which together carry enough weight to mask broad cyclical weakness in Industrials (-1.07%), Materials (-1.14%), Consumer Discretionary (-1.42%), and Utilities (-1.31%). The equal-weight S&P (RSP) is likely tracking -0.6% to -0.8%, roughly 6x the headline loss.
What does a VIX spike of 4.57% with the S&P only down 0.11% actually signal?
Implied volatility is expanding roughly 41x faster than realized, which the vol desks call a vol-of-vol bid. It typically reflects dealer short-gamma reloading and positioning unwind rather than new fundamental information, and it often precedes a directional break once liquidity arrives at the 10:00 ET data drop.
What is the key level on the 10Y Treasury yield to watch on Jun 1?
The 10Y at 4.47% sits 3bp below the 4.50% line traders are watching. A break above 4.50% on a hot JOLTS print (>8.0M) combined with ISM Manufacturing >50.0 would force another leg of duration selling into Utilities and Real Estate.
Why is HOOD -7.49% considered a leading signal for the broader index?
Retail-broker beta typically leads index direction by 1-2 sessions when momentum unwinds. HOOD down 7.49% to $87.24, paired with MSTR -9.01% and IREN -4.97%, shows the highest-beta corners of retail flow de-grossing while the cap-weight index is still flat — the same divergence pattern that preceded the early-May correction.
Which scenario is most likely after the 10:00 ET data drop?
The bear case is assigned 60% probability — JOLTS above 8.0M and ISM above 51.0, pushing the 10Y through 4.50% and the S&P toward a 7,540 test, closing near 7,495 (-1.0%). Base case (20%) is a range-bound 7,545-7,585 with no resolution intraday; bull case (20%) requires JOLTS below 7.7M and ISM below 49.0.
Data sources: Yahoo Finance · SEC EDGAR
This analysis is provided for educational and informational purposes only. It is not investment advice. Consult a qualified financial advisor before acting on any information presented here.


