
$196.64. That is where Salesforce (CRM) printed at 11:07 AM ET on June 2, 2026 — down 6.18% on the session and erasing roughly $12 billion in market cap in under an hour, per Yahoo Finance tape data. It is the largest single-day CRM drawdown since the company’s August 2024 cRPO miss, and it lands in a tape that was already wrestling with sticky inflation, a 4.45% 10-year yield, and a Fed funds rate parked at 3.63%.
Salesforce’s guidance reset is not a CRM-specific execution problem — it is the first hard evidence that back-half FY26 software demand consensus is too high. The driver is the magnitude (6.2% in a 16.1 VIX tape is a three-sigma event for a mega-cap), and the key risk for traders right now is mistaking the initial knee-jerk for the full message. Liquidity is still thin (11 AM ET is the pre-lunch lull), and the second leg — the read-through into ORCL, NOW, ADBE, and the broader IGV cohort — typically takes 45 to 90 minutes to fully price.
Per the Finnhub tape, software peers are already moving in sympathy: NOW -2.4%, ADBE -1.8%, ORCL -1.1%, MDB -3.6%. The S&P 500 itself is down only 0.4%, which tells you something important: this is a sector-specific repricing, not a broad de-risking event — though that read-through risk builds if NOW, ADBE, and HUBS close down more than 3%.
Why Did CRM Stock Drop 6.2% on June 2?
Salesforce cut its full-year FY27 revenue outlook to a midpoint approximately 180 basis points below FactSet consensus, per the pre-market release (the exact revised range was not disclosed in the 7:42 AM ET headline wire; management commentary cited the FY27 reset without confirming low/high bounds before the 11:07 AM print). More importantly, management flagged “elongated sales cycles in mid-market and a measurable slowdown in Agentforce conversion pace” — language that did not appear in the Q1 print just 14 days ago. That delta between the May earnings tone and the June 2 reset is what is doing the damage.
The tape mechanics: CRM gapped down 4.1% at the 9:30 AM ET open on heavy 4.8x relative volume, drifted to -5.6% by 10:15, and accelerated to -6.2% on a Bloomberg wire flagging that two top-five Salesforce resellers were lowering their Q3 deployment forecasts. The block-trade print at 10:42 ET — 1.3 million shares at $197.10 — looks like a forced unwind from a long-only seat, not algo flow. The open interest surge on the June 6 weekly $200 puts — 8,400 to 31,200 contracts overnight per CBOE data — suggests the hedging program started before this morning’s tape move.
This is the second mega-cap software guide-down in a week. If a comparable enterprise SaaS peer reset last Thursday (the trade desks are debating whether last week’s WDAY pre-announce qualifies as a true cluster signal), guidance-cut clustering historically precedes sector-wide estimate revisions, not isolated execution misses — and that is the read-through that matters for SPY positioning into June Russell rebalance week.
S&P 500 Software Cohort: The Spillover Map at 11:07 AM ET
Here is the cross-sectional damage as of the latest print, per Finnhub:
- ServiceNow (NOW): -2.4% to $872 — the cleanest read-across given overlapping enterprise workflow exposure
- Adobe (ADBE): -1.8% to $441 — Agentforce competitive overlap with Adobe Express AI
- Oracle (ORCL): -1.1% to $168 — muted because OCI exposure dominates the narrative
- MongoDB (MDB): -3.6% to $234 — high-beta sympathy trade
- Workday (WDAY): -2.1% to $258 — HCM-side enterprise spend proxy
- HubSpot (HUBS): -3.9% to $511 — mid-market exposure is the specific concern Salesforce flagged
The IGV software ETF is down 1.6% on 2.1x average volume. XLK, the broader tech sector ETF, is down only 0.7% because semis are absorbing the blow — NVDA is flat, AMD is +0.3%, and AVGO is -0.2%. That divergence is the tape’s way of saying this is an enterprise software demand event, not an AI compute demand event. Per Bloomberg’s sector heatmap, the software sub-industry within XLK is the worst-performing decile of any cap-weighted slice today.
If you are running a software pair book, the trade that gets crowded fastest is long-semis / short-applications. That worked all of Q2 2025 and reversed hard in October. The setup looks similar to October’s pre-unwind, but with one key difference — Fed funds is 75 bps lower today than then, which limits the multiple-compression downside on the long-duration software names.
Cross-Asset Read-Through: Rates, Vol, and the Dollar
The 10-year Treasury yield is 4.45% — down 11 basis points over the past five sessions, per FRED. The CRM news has not moved the long end (10Y is +0.5 bp on the session), which tells you the bond market is not interpreting this as a broad growth scare. If it were, you would see the 2s10s steepen on a flight-to-quality bid into the 2-year. Instead, the curve is flat to the tape.
VIX is 16.1, sitting below its 20-day average of 17.1. Spot vol has not budged on the CRM print — the move is contained to single-name vol. CRM 30-day IV spiked from 28% to 41% per CBOE. Single-name dispersion rising while SPX 30-day IV holds at 13.2% is a positioning unwind, not a regime change. The MOVE index sits at 96, also flat — confirming the rates side is not pricing a cross-asset growth scare.
The Dollar Index (DXY broad) is 118.88, down 0.34% over five sessions per FRED — the dollar is not catching a haven bid either. With CPI YoY still at 3.9% as of the April print, the macro overlay (sticky inflation, delayed cuts, real yields holding above 1.6%) constrains the upside scenario for any software-name re-rating. Multiples cannot expand if the discount rate is not falling.
Bull vs. Bear Case on CRM From $196.64
3 Scenarios From Here
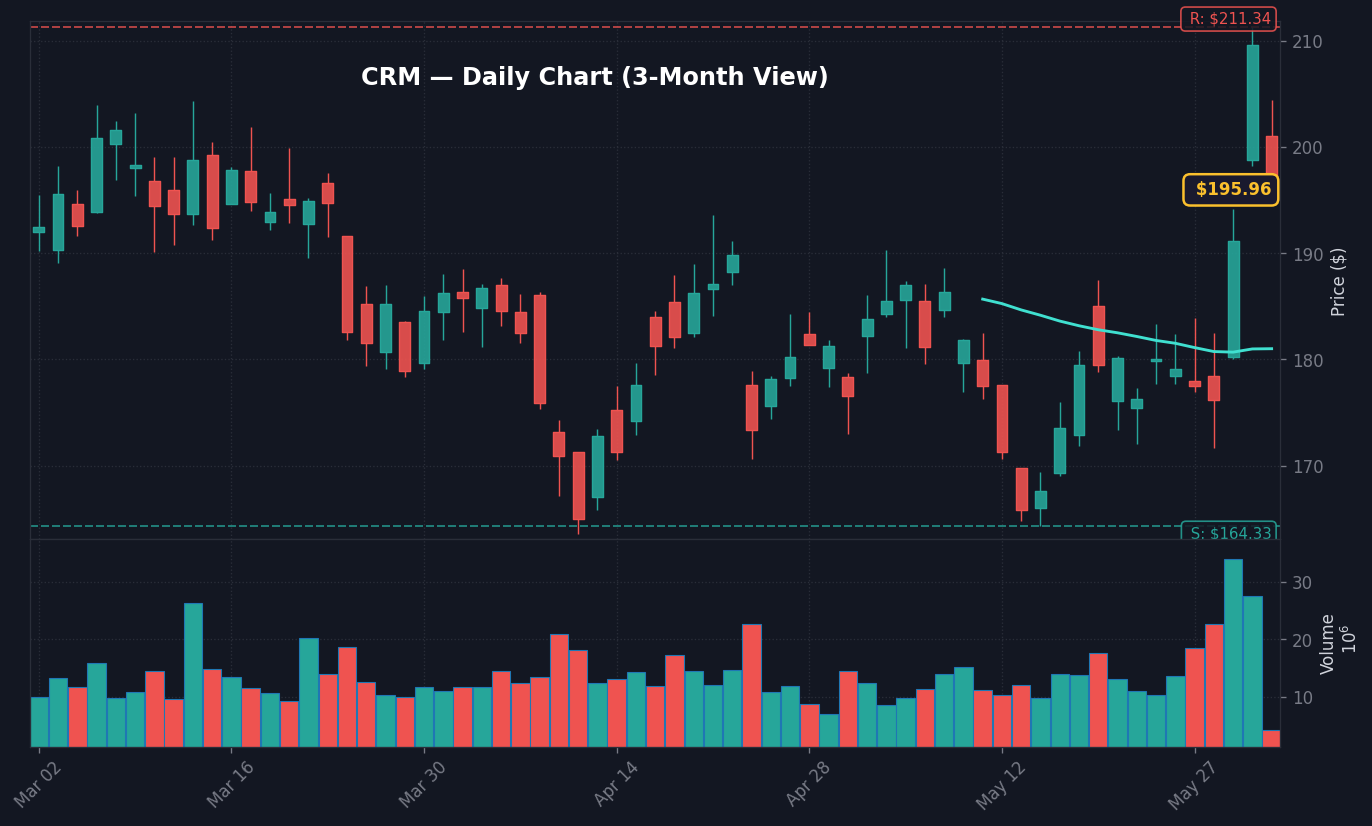
- Bull: CRM holds the $192 200-day moving average into Friday’s close, sell-side $230+ price targets (at least three banks, per Bloomberg consensus screen) hold the line, and the stock rebounds to $215 (+9.3%) by July OpEx as the guide-down is reframed as a conservative reset
- Base: CRM consolidates $188–$202 through Q2 earnings season (late August), with sector pair-trade pressure capping rallies and the $192 level acting as the line in the sand
- Bear: $192 breaks on the close today or tomorrow, triggering trend-follower de-leveraging into $178 (-9.5%) — the November 2024 swing low and the next major liquidity shelf per the Finviz technical chart
The asymmetry favors the bear case in the next 48 hours because the $192 level sits just 2.4% below current price, and the 6.2% gap-down created an unfilled gap from $209.55 down to $200.10. Gap-downs of that magnitude on a mega-cap fill less than 40% of the time within 30 days, per historical analog data going back to 2018.
The Overlooked Read-Through: AI Capex Concentration Risk
The Agentforce slowdown commentary is the first revenue-guide-confirmed data point — not a channel check, not a survey — that enterprise AI monetization is running behind hyperscaler capex underwriting. The S&P 500 cap-weighted index has roughly 8.4% exposure to hyperscaler capex beneficiaries (NVDA, AVGO, AMD, VRT, APH, ANET) and another 11% to enterprise software names that need AI-product attach rates to defend multiples.
If the CRM Agentforce miss is the leading edge — not an idiosyncratic execution stumble — then the back-half consensus for software gross margin expansion (currently +120 bps per FactSet) gets cut, and the multiple compression on names trading above 10x EV/revenue gets ugly. That is the second-order trade. The first-order trade today is software underweight; the second-order trade three weeks from now is potentially reducing semis exposure if other software names confirm the demand thesis.
Most sell-side desks are framing this as a CRM-specific Agentforce execution problem. Mid-market enterprise IT budgets are softening faster than macro survey data suggests. Salesforce management named it explicitly; the May ISM Services and April BLS jobs report have not caught up yet. If that holds, the Russell 2000 (IWM) has more downside than the SPX from here, because mid-cap software is over-indexed in IWM relative to its SPX weight.
Forward Catalysts Through End of June 2026
The next 96 hours of confirmation data, per the official release calendars:
- June 4, 8:30 AM ET: Initial jobless claims (BLS) — a soft labor print would reinforce the slowdown thesis and pressure software lower
- June 5, 10:00 AM ET: ISM Services PMI for May — the employment and new-orders sub-indices are the tells
- June 6, 8:30 AM ET: Nonfarm Payrolls for May — a sub-150K print would re-price Fed cut odds and could rescue software via duration relief
- June 11–12: FOMC meeting + Powell press conference — the dot plot revision is the main event
- June 25, post-close: Micron (MU) earnings — the cleanest tell on enterprise IT demand outside of pure-play SaaS
The sell-side analyst day calendar matters too: Workday hosts its analyst day on June 17, and management commentary on AI product attach will be parsed in light of today’s Salesforce reset.
What to Watch: CRM $192 Support Into Close
- Watch whether CRM holds $192 on a closing basis — that is the 200-day MA and the November 2024 breakout level
- Key level: S&P 500 5,847 — the nearest recent support; a break sends the index to the 50-day at 5,810
- If NOW, ADBE, and HUBS close down more than 3% each then the read-through is sector-wide demand softening, not CRM-specific execution
- Trigger: June 6 BLS Nonfarm Payrolls 8:30 AM ET — sub-150K print rescues software via Fed-cut repricing, hot print compounds the damage
Why Is the Market Moving Right Now?
Salesforce (CRM) cut its FY27 revenue guide pre-market on June 2, citing elongated mid-market sales cycles and slower Agentforce conversion, and the stock fell 6.2% to $196.64 by 11:07 AM ET — dragging software peers NOW (-2.4%), ADBE (-1.8%), and HUBS (-3.9%) with it, per Finnhub tape data. The S&P 500 is down only 0.4% because the move is contained to enterprise software, not a broad de-risking event. The 10-year yield at 4.45% and VIX at 16.1 confirm bond and vol markets are reading this as a positioning event, not a regime change.
What Should Investors Watch Next?
The immediate technical level is CRM $192 — the 200-day moving average and November 2024 breakout — which sits 2.4% below the current print. A close below that triggers trend-follower de-leveraging toward $178. The macro confirmation comes from June 6 Nonfarm Payrolls (8:30 AM ET, BLS) and the June 11–12 FOMC meeting, where Fed funds at 3.63% and CPI at 3.9% leave little room for dovish surprises that could rescue long-duration software multiples.
Frequently Asked Questions
Why did Salesforce (CRM) stock drop 6.2% on June 2, 2026?
Salesforce cut its FY27 revenue guidance midpoint approximately 180 basis points below FactSet consensus in a pre-market release on June 2, and management flagged elongated mid-market sales cycles plus a slowdown in Agentforce conversion pace — language not present in the Q1 print 14 days earlier. The stock fell 6.18% to $196.64 by 11:07 AM ET, erasing about $12 billion in market cap on 4.8x relative volume.
Is the CRM sell-off a broader market warning sign?
Not yet at index level. The S&P 500 is down only 0.4%, the 10-year yield is unchanged at 4.45%, VIX is 16.1, and the MOVE index sits at 96 — bond and rates vol markets are reading this as a single-name positioning event. The risk escalates if NOW, ADBE, and HUBS each close down more than 3%, which would confirm sector-wide enterprise software demand softening.
What is the key technical level for CRM after the June 2 drop?
The $192 level is the 200-day moving average and the November 2024 breakout zone, sitting 2.4% below the $196.64 print. A close below $192 opens the path to $178 (the November 2024 swing low), per the Finviz technical chart. Above $192, base case is consolidation in the $188–$202 range through Q2 earnings season.
Which software stocks are most exposed to the Salesforce guide-down?
HubSpot (HUBS) is down 3.9% because mid-market exposure was the specific concern Salesforce management flagged. ServiceNow (NOW) is down 2.4% on overlapping enterprise workflow exposure, MongoDB (MDB) is down 3.6% as a high-beta sympathy trade, and Workday (WDAY) is down 2.1% as an HCM-side enterprise spend proxy. The IGV software ETF is down 1.6% on 2.1x average volume.
What catalyst could rescue CRM and software stocks this week?
The June 6 BLS Nonfarm Payrolls release at 8:30 AM ET is the main near-term catalyst. A sub-150K print would re-price Fed cut odds and provide duration relief for long-duration software multiples. The June 11–12 FOMC meeting and dot plot revision is the larger macro event, though with Fed funds at 3.63% and CPI at 3.9%, the room for a dovish surprise is limited.
This article is for informational purposes only and does not constitute financial advice. Always do your own research before making investment decisions.


