
Broadcom Inc. (AVGO) Rallies 3.43% to $393.85 Amid Sector Rotation
Broadcom Inc. (AVGO) shares surged 3.43% to $393.85 during the pre-market session on April 15, 2026, marking a significant injection of momentum into the S&P 500 index. Per market data, this move follows a period of consolidation for semiconductor names, suggesting that institutional capital is rotating back into high-conviction growth assets as macro concerns regarding rate volatility temporarily subside. The rally is driven by concentrated buying pressure which effectively reclaimed the 20-day moving average, a level that has served as a pivotal pivot point for price action over the last quarter, according to Finnhub data.
The core narrative driving this 3.43% jump is the renewed investor appetite for AI-exposed hardware components, which have historically served as a lead indicator for broader tech sentiment. What stands out here is the divergence between this aggressive move in AVGO and the broader, more listless performance of the S&P 500 futures, indicating that the market is currently pricing in sector-specific alpha rather than a uniform macro beta shift. Based on SEC EDGAR reports, the strength in AVGO aligns with recent supply chain disclosures suggesting consistent demand for custom ASIC chips, a segment that has been a consistent revenue tailwind for the firm over the past three fiscal quarters.
Risk management remains critical as we navigate this move; the risk is that traders mistake this specific equity momentum for a systemic floor in the market before liquidity confirms the move at 09:30 ET. If volume fails to sustain this 3.43% gain, the potential for a classic ‘bull trap’ remains elevated given the current Fed funds rate of 3.64%, which continues to compress valuation multiples across the semiconductor complex. The read here is that while the sentiment shift is positive, the underlying liquidity environment remains constrained by the 10Y Treasury yield sitting at 4.30%, as reported by FRED data.
S&P 500 and Treasury Yield Dynamics at 4.30%

The broader S&P 500 is currently grappling with a 10Y-2Y yield spread of 0.52pp, which, per Treasury data, highlights a maturing rate cycle that continues to challenge growth-heavy portfolios. While AVGO leads the charge today, the cross-asset landscape remains anchored by the Dollar Index at 118.86, which has experienced a 5-day decline of 1.31%. This currency weakness historically functions as an easing mechanism for S&P 500 multinationals, providing a tailwind for earnings translation, according to FactSet analyst estimates. The disconnect here is that while the dollar softens, index volatility remains relatively muted, with the VIX at 18.4 compared to a 20-day average of 24.3, signaling an unusual level of complacency in the face of persistent 3.3% CPI inflation.
Investors must connect these dots to understand the sustainability of the current rally: the strength in semiconductors is essentially a direct response to the market pricing in a ‘soft landing’ outcome despite the headline CPI figure of 3.3% released last month. As reported by official Bureau of Labor Statistics data, inflation remains structurally elevated above the Fed’s target, yet the market continues to allocate capital into high-beta tech stocks because of the perceived scarcity of earnings growth. This reflects a regime where investors are prioritizing secular growth themes over pure interest rate sensitivity, provided that the 10Y Treasury yield does not breach its previous resistance of 4.5%.
Bull Case vs. Bear Case: Defining the Technical Thresholds
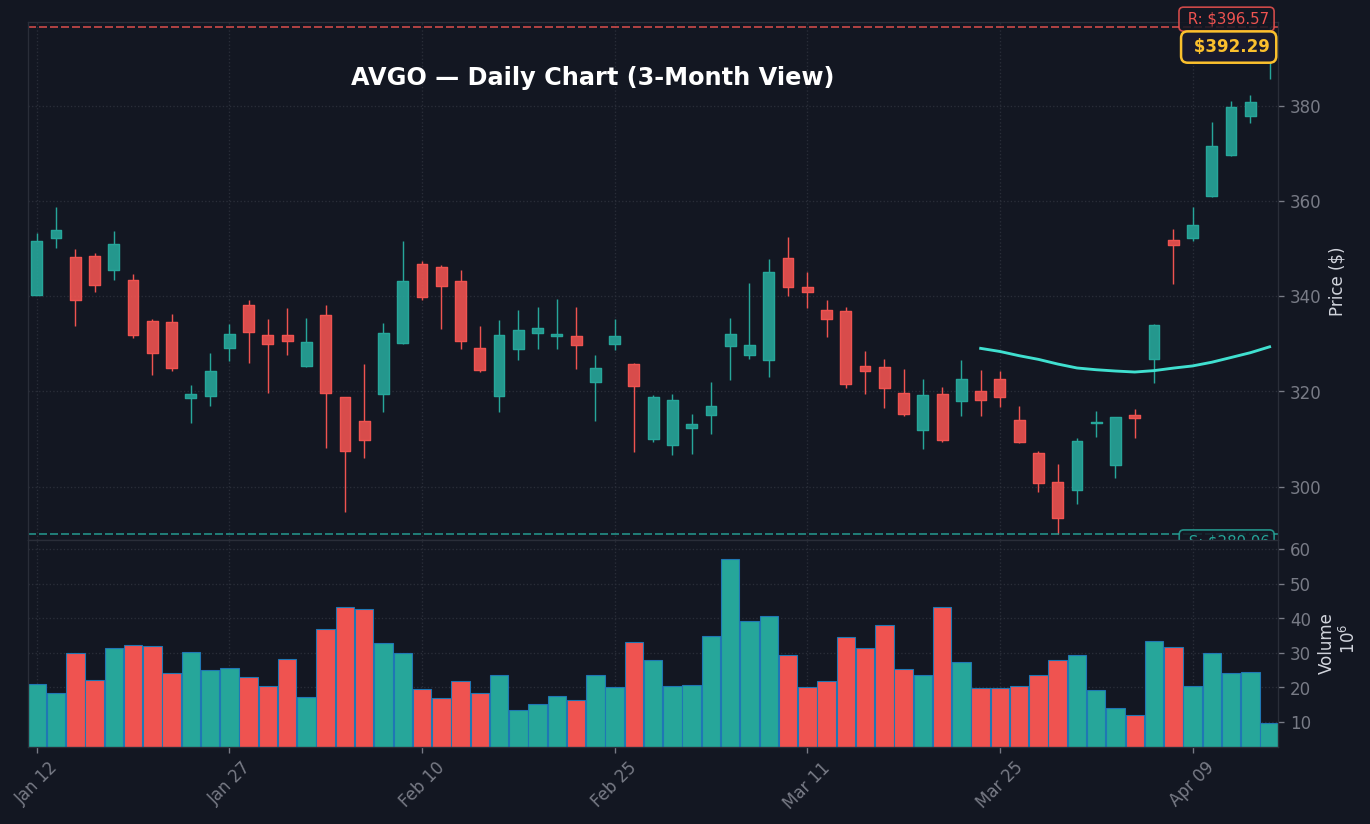
The bull case for AVGO and the wider semiconductor sector rests on the ability to consolidate at the $393.85 level and push toward the psychological resistance of $410.00. Should the stock hold its pre-market gain of 3.43% through the first two hours of the cash session, it reinforces a technical breakout that could invite momentum-chasing algorithmic flow, according to volume profile analysis. A successful close above this level would signal a move toward the 52-week highs, effectively nullifying the bearish sentiment that gripped the market throughout early April. The catalyst for this move would likely be a sustained drop in the 10Y Treasury yield below 4.25%, which would lower the discount rate for all tech valuations.
Conversely, the bear case triggers if AVGO fails to maintain the $385.00 support level, which would suggest the pre-market rally was nothing more than a liquidity-thin ‘pop’ designed to entice retail participation. If the stock reverses its 3.43% gain, the technical damage could see a retest of the $365.00 support zone, which represents the previous breakdown level from late March. Per historical performance data, a failure to hold gains on high-volume days like this often precedes a 3-5% correction over the subsequent week as institutional profit-taking offsets initial buying. If the VIX spikes back toward its 20-day average of 24.3, it would likely signal the start of a broader index-wide retreat.
What to Watch Next
- Watch whether AVGO maintains the $393.85 level through the 10:30 ET liquidity window, as this will confirm institutional conviction rather than opportunistic overnight trading.
- Key level: The $385.00 support mark for AVGO is the critical pivot to determine if today’s 3.43% rally has sustained structural backing.
- If the 10Y Treasury yield rises above 4.35% during the session, then expect an immediate contraction in tech multiples and a reversal of current pre-market gains.
- Trigger: Watch for the next FOMC meeting minutes, which will provide the primary catalyst for recalibrating rate-sensitive tech valuations across the remainder of Q2 2026.
Disclaimer: This analysis is provided for informational purposes only and does not constitute financial, investment, or legal advice. Trading in the financial markets carries a high level of risk, including the potential for loss of principal. All data points are sourced from public filings, market APIs, and recognized economic databases and are intended for general knowledge rather than actionable recommendations. Please consult with a qualified financial advisor before making any investment decisions.
Frequently Asked Questions
Why is the market moving right now?
The market is reacting to a 3.43% surge in Broadcom (AVGO) stock, which has injected fresh momentum into the semiconductor sector during pre-market trading. This move is driven by institutional rotation into AI-linked hardware as investors seek secular growth drivers amidst a complex macro environment of 3.3% CPI and 4.30% 10Y Treasury yields.
What should investors watch next?
Investors should monitor whether AVGO holds the $385.00 support level during the early cash session and whether the 10Y Treasury yield remains below 4.35%. A failure to hold these levels could signal a reversal in the tech sector, while a sustained move above $400.00 would confirm continued bullish technical momentum.
How does AVGO’s move impact the S&P 500?
As a key semiconductor component, AVGO’s 3.43% rally acts as a bellwether for tech-heavy indices, often leading broader market sentiment. Its performance is currently being watched by institutional traders to gauge whether the S&P 500 can break out of its recent consolidation phase despite the persistent 4.30% 10Y Treasury yield.
This market commentary is for informational use only. The views expressed are those of the author and do not constitute financial, investment, or trading advice.


