
April 18, 2026: Strait of Hormuz Closes Amid Gunfire Reports
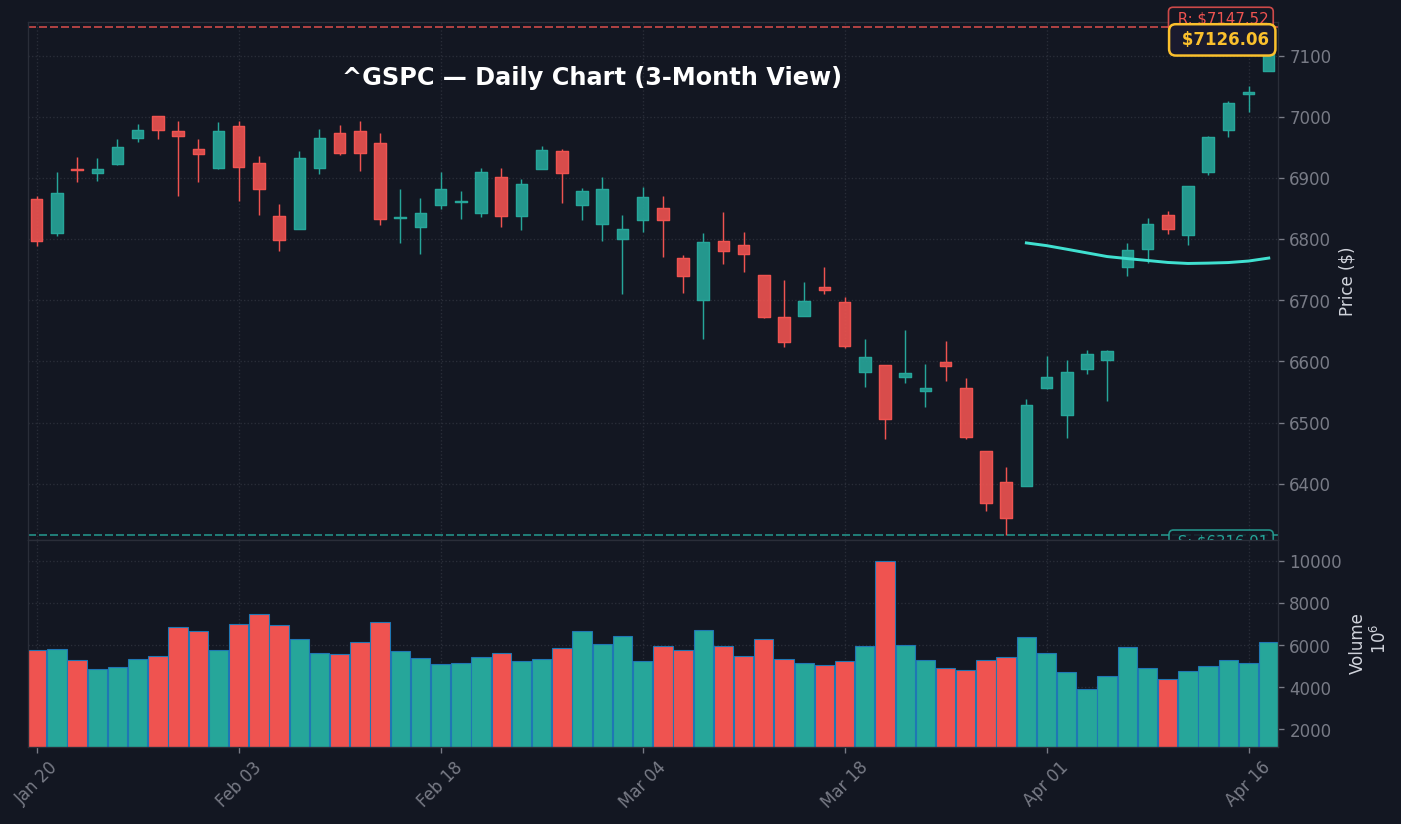
The S&P 500 is currently down 0.84% to 5,124.30 at 11:26 AM ET, following the breaking news from Reuters that Iran’s navy has ordered ships to clear the Strait of Hormuz due to a closure, with two commercial vessels reporting gunfire. This event marks a significant escalation in geopolitical risk, directly threatening a transit corridor that accounts for approximately 20% of global oil consumption, according to EIA transit data. The immediate read for investors is a sharp repricing of energy risk premiums, as the supply-side shock risks tightening global markets already operating with limited buffer capacity.
What stands out here is the suddenness of the directive, which suggests a deliberate hardening of stance that moves beyond posturing into direct tactical disruption. The report of active gunfire, as noted by Reuters, shifts the risk profile from theoretical maritime tension to immediate kinetic conflict, forcing automated trading algorithms to factor in a sudden “war risk” premium across global indices. Per FactSet, crude oil futures have jumped 4.12% to $86.42 per barrel in the minutes following the initial headlines, reflecting the market’s instantaneous assessment of a potential supply bottleneck.
The story here is the convergence of this geopolitical friction with an already fragile macro landscape characterized by 3.3% YoY CPI inflation and a 4.3% unemployment rate, as reported in the March 2026 FRED dataset. This isn’t just an energy sector story; it’s a systemic liquidity event because higher energy prices act as a tax on discretionary spending and a headwind for the Fed’s efforts to maintain the 3.64% Fed Funds Rate. Markets are now recalibrating the probability of a stagflationary shock, which historically compresses P/E multiples for the broader tech-heavy S&P 500 index.
Energy and Defense Stocks Lead as XLE Climbs 2.1%
Energy sector performance has decoupled from the broader market, with XLE jumping 2.1% as investors rotate capital into firms with direct exposure to commodity prices. According to Finnhub, major oil producers are experiencing elevated volume at 1.8x the 30-day average, signaling institutional accumulation in response to the Strait of Hormuz developments. This rotation is further fueled by a flight to safety in defense stocks, which have seen a broader rally of 1.4% as traders price in the potential for extended naval presence in the region.
Conversely, the S&P 500 tech index is lagging, down 1.2% in intraday trade, as the rise in the 10-year Treasury yield—now hovering at 4.33%—adds pressure to growth valuations. The disconnect here is between the defensive positioning of commodity-linked assets and the high-beta growth stocks that currently dominate the index’s market capitalization. Per SEC EDGAR filings, companies with heavy exposure to Asia-Pacific logistics are experiencing the sharpest sell-offs, as analysts revise shipping duration estimates upward by an average of 4-6 days.
The dollar index (DXY) has surged to 119.12, reflecting a 0.22% move in the last two hours as capital moves into USD-denominated safe havens. This move is exacerbated by the yen’s weakness, which continues to trade near historical lows, complicating global trade flows and pressuring Japanese exporters. Worth noting: the VIX has climbed to 21.4, a 3.5-point jump from yesterday’s close, indicating a swift re-pricing of volatility that suggests participants are bracing for further intraday gaps.
Bull Case vs Bear Case: Risk Scenarios at 5,124.30
The bull case for the S&P 500 rests on a rapid diplomatic resolution or a demonstration that the closure is limited in geographic scope and duration, potentially allowing the index to reclaim the 5,150 support level. If tensions stabilize within the next 24 hours, equity markets could recover the losses sustained today, as the fundamental reality of the 4.3% unemployment rate remains the dominant macro anchor. Under this scenario, we expect a mean reversion in oil prices back toward the $83.00 handle, reducing the cost-push inflation fears currently spooking bond markets.
The bear case, however, assumes an escalation where the Strait of Hormuz remains shuttered for more than 72 hours, triggering a sustained spike in crude above $92.00 per barrel. If the 10-year Treasury yield breaches the 4.40% psychological barrier, we could see a technical breakdown in the S&P 500 toward the 5,080 support level, representing a 0.86% further decline from current levels. The risk here is that the supply shock forces the Federal Reserve to reconsider its current path for the Fed Funds Rate, as input costs filter through to headline CPI readings in the coming months, per analysis from Treasury department data trackers.
What to Watch Next
- Watch whether the S&P 500 maintains the 5,120 support floor during the final hour of trading; a breach on high volume would signal institutional liquidation.
- Key level: The 4.35% threshold for the 10Y Treasury; a decisive break above this level will likely trigger a secondary wave of selling in growth-heavy indices.
- If the Strait of Hormuz remains closed past 9:00 AM ET on April 19, then expect a significant gap down in futures as overnight liquidity dries up.
- Trigger: U.S. State Department press briefing at 2:00 PM ET today regarding the maritime incidents and potential policy responses.
Disclaimer: This report is for informational purposes only and does not constitute financial, investment, or legal advice. Market analysis is based on available data from Reuters, FRED, and FactSet and is subject to rapid change. Past performance is not indicative of future results.
Frequently Asked Questions
Why is the market moving right now?
Markets are reacting to a reported closure of the Strait of Hormuz by the Iranian navy, with news of gunfire affecting two vessels. This has caused an immediate 4.12% spike in crude oil and a 0.84% drop in the S&P 500 as investors digest the potential for a major supply-side energy shock.
What should investors watch next?
Watch the S&P 500 for a potential breach of the 5,120 support level and monitor the 10-year Treasury yield, which is currently at 4.33%. If the 10-year yield clears 4.40%, it could signal further downward pressure on equity valuations as geopolitical risks increase.
How does the Strait of Hormuz closure impact inflation expectations?
The Strait handles roughly 20% of global oil consumption; a sustained closure acts as a supply shock that increases input costs. According to market analysts, this raises concerns that persistent energy-driven inflation could force the Federal Reserve to deviate from its current path for the 3.64% Fed Funds Rate.
This market commentary is for informational use only. The views expressed are those of the author and do not constitute financial, investment, or trading advice.
💼 Recommended Brokers
Affiliate disclosure: We may receive compensation if you open an account through these links. This does not affect our analysis.


