Market SnapshotAs of 2026-07-18 09:06 ET (intraday change)
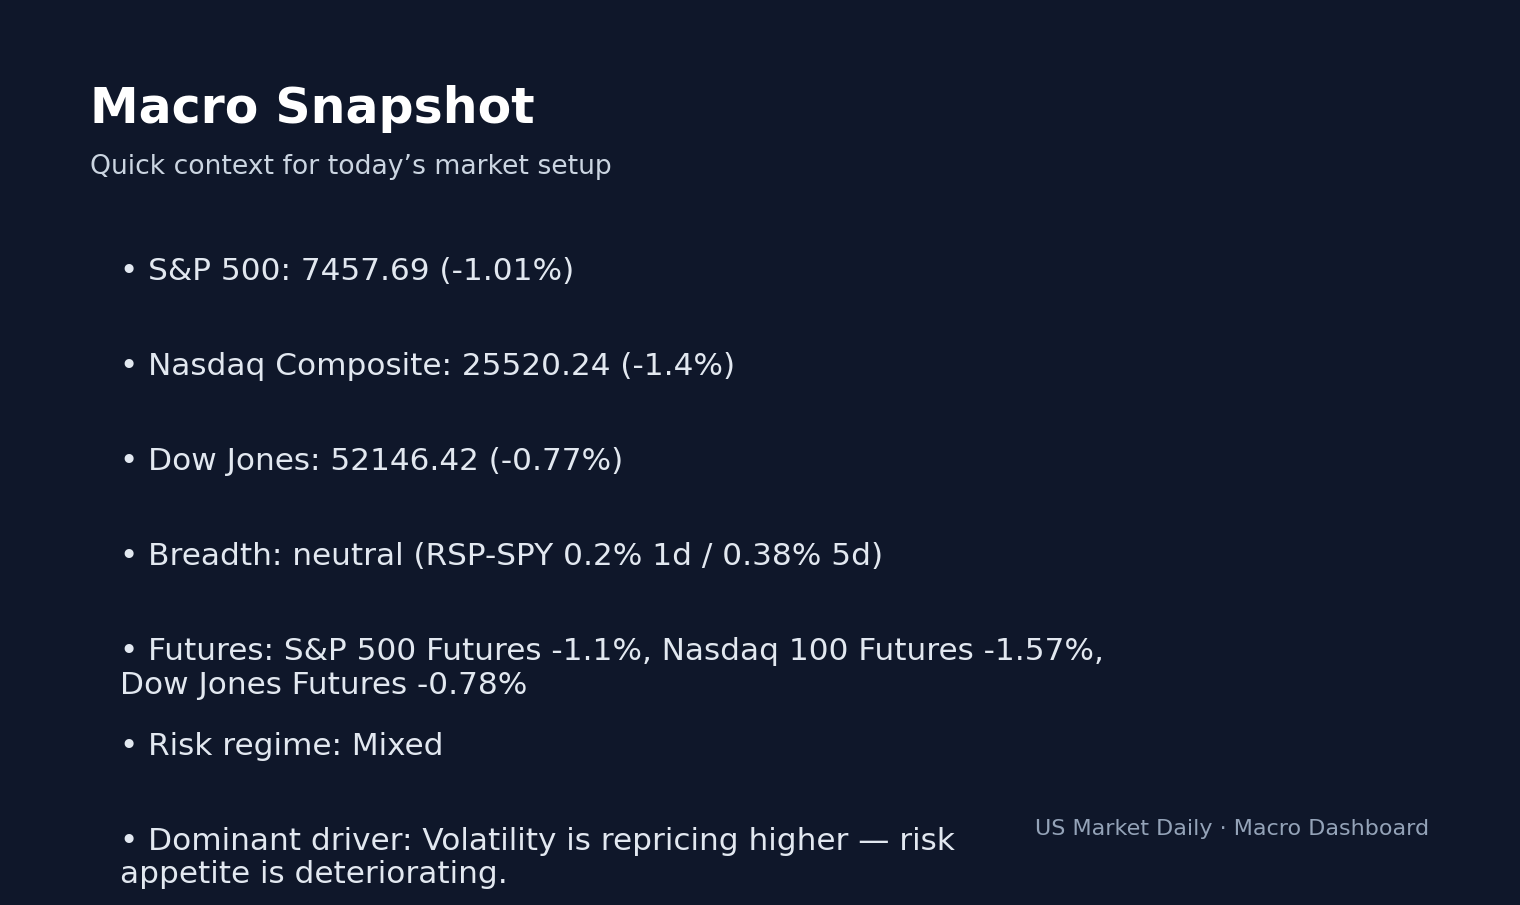
S&P 500
$743.29
▼ -0.99%
Nasdaq 100
$695.33
▼ -1.50%
Russell 2000
$294.04
▼ -0.52%
VIX
18.77
▲ +12.19%
US 20Y
$84.52
▲ +0.37%
Dollar
100.75
◆ +0.02%
Gold
$368.41
▲ +0.95%
WTI rose 2.5% to $72.26 this week as EIA data showed a 1,692 Mbbl crude draw and inventories sitting 6.3% below the five-year seasonal average. While crude supply tightened, the real story resides in equity dispersion: refiners are leading the tape while upstream producers remain heavily discounted.
Energy Market Scorecard — July 18, 2026 (Source: EIA)
The headline draw was 1,692 Mbbl, but the more important EIA signal is the stock level: U.S. crude inventory sits at 409,665 Mbbl, 6.3% below the five-year seasonal average, per the EIA report. That matters because a deficit versus the five-year seasonal band changes how traders price the next barrel.
WTI rose $1.78 to $72.26, per EIA spot data. While this move sits inside the eight-week range of $70.48 to $105.32, it occurred with inventories already undersupplied. Lower commercial stocks reduce cushion, which in turn raises the value of prompt supply, supporting crude even when demand is not accelerating.
Worth noting: the draw is not happening from a comfortable base. EIA data show inventories are down 12,497 Mbbl year over year. That is why $72.26 WTI reflects a tight physical balance despite trading far below the eight-week high of $105.32.
8,844 kbd Gasoline Demand Keeps the Balance Tight, But Not Hot
Gasoline demand was 8,844 kbd, down 1 kbd on the week and below the four-week average of 8,899 kbd, per EIA data. Stable product demand is enough to keep refinery runs from collapsing, yet it lacks the velocity to turn every energy equity into a momentum trade.
The EIA inventory draw and 6.3% undersupply versus the five-year seasonal average point to crude support. Simultaneously, gasoline demand at 8,844 kbd suggests the consumer side is not flashing a demand boom. The result is a market where upstream beta receives support from barrels, while refining equities require a distinct margin check.
The overlooked signal is gasoline demand as a real-economy gauge. If 8,844 kbd holds near the 8,899 kbd four-week average, the consumer side of the barrel is not flashing recession. For VLO and MPC, crude price is the secondary question; product demand and crack spreads decide whether new highs are earned or faded.
VLO at $309.65 and MPC at $312.60 Are Sending a Different Message Than COP
Energy equities are diverging. Valero is at $309.65, 2.0% above its 52-week high, while Marathon Petroleum trades at $312.60, 1.4% above its 52-week high, per supplied equity data. This reflects an equity market prioritizing refining margins over raw crude beta.
ConocoPhillips at $114.71 remains 15.6% below its 52-week high, per the same data. Exxon Mobil at $147.36 is 16.5% below its 52-week high, and Chevron at $187.38 is 12.7% below. Those discounts are notable because WTI is up 2.5% this week. The tape is not yet paying upstream producers full credit for the EIA draw.
That gap creates the week’s cleanest equity read. If the 409,665 Mbbl inventory level confirms a tighter prompt market, COP should respond more directly than VLO or MPC, as COP remains pure upstream, per supplied sector classification.
XLE at $57.68 Shows the Upstream Trade Has Not Been Fully Repriced
XLE sits at $57.68, 9.1% below its 52-week high, while XOP is at $170.18, 10.6% below its 52-week high, per supplied ETF data. Broad energy ETF pricing remains below prior peaks despite the tightening crude backdrop.
What stands out here is the sector dispersion. Refiners trade above prior highs, midstream is near its high, and upstream-linked baskets remain roughly 9% to 11% below their highs. This is not a uniform rally; it is a selective market rewarding downstream margins first, infrastructure second, and crude beta third.
Few are talking about the fact that a crude draw does not automatically guarantee a lift for every energy ticker. Transmission depends on business model. COP gets the cleanest upstream read, while VLO and MPC need product cracks to hold.
VIX at 18.77 Makes This a Stock Picker’s Energy Tape
The cross-asset backdrop is neutral. VIX is 18.77, VIX3M is 20.54, and the term spread is +1.77, showing mild contango, per yfinance and CBOE-listed options data. This gives equity investors room to price company-specific cash flow rather than selling cyclical exposure wholesale.
SPX options imply a ±3.45% move over the next 30-day expiry, per yfinance. The Fed rate sits at 3.50% to 3.75%, while June 2026 CPI is 333.952 and PPI is 154.196, per supplied context. If WTI stays above $72.26 while inventories remain 6.3% below the five-year average, energy risks becoming a persistent margin story across the broader economy.
Bull: another EIA draw with inventories below the five-year average → WTI retests the upper half of the range above $72.26
Base: gasoline demand holds at 8,899 kbd and inventories stay near 409,665 Mbbl → WTI grinds around the $70.48–$72.26 pivot
Bear: gasoline demand breaks below 8,844 kbd and inventories rebuild → WTI tests the $70.48 support
The asymmetry lies in the inventory cushion. With crude inventories 6.3% below the five-year average, bad demand data could pressure WTI quickly, but another draw provides a cleaner path to force short-covering.
The bull case needs confirmation from the next EIA print. The base case relies on gasoline demand holding near the 8,899 kbd average. The bear case requires a pivot in the product signal: if demand fades from 8,844 kbd and inventories stop drawing, the market loses the core support behind this week’s 2.5% move.
The Non-Obvious Call: Refinery Margins Matter More Than $72.26 Crude
The tape is failing to distinguish between crude tightness and downstream profitability. A draw to 409,665 Mbbl supports crude, but it also raises feedstock costs for refiners. Since VLO at $309.65 and MPC at $312.60 are already trading above 52-week high references, the next leg requires crack-spread resilience, not just a crude bid.
This is why gasoline demand at 8,844 kbd is the key datapoint. If product demand holds, refiners can defend their levels because volumes support pricing. If demand fades, crude tightness becomes a margin squeeze.
EIA Inventory Watch: 409,665 Mbbl Pivot
Watch whether crude inventories extend the 1,692 Mbbl draw rather than rebuilding from 409,665 Mbbl.
Key level: $70.48 WTI; this is the primary downside support level.
Confirm: A sustained hold above $72.26 and another inventory draw would confirm the bullish thesis for upstream producers like COP.
Invalidate: A break below 8,844 kbd in gasoline demand combined with an inventory build would break the current bull setup for energy equities.
Market Snapshot — Verifiable Reference Data
The following ETF and benchmark prices are sourced from public market data and serve as the reference points for the analysis above. All values reflect the latest available close.
Ticker
Description
Price
Change
XLE
Energy Sector ETF
$57.68
+1.16%
USO
US Oil Fund
$123.96
+3.91%
CVX
Chevron
$187.38
+1.91%
XOM
ExxonMobil
$147.36
+0.97%
OXY
Occidental
$54.86
+2.26%
Primary Sources & Further Research
This analysis is based on publicly available primary data. According to EIA Weekly Petroleum Status, the underlying data series provide the most authoritative measurement for verification. Cross-reference with EIA Natural Gas Storage and FRED — WTI Crude (DCOILWTICO) is recommended before acting on any single signal. The full source list below covers the dataset used in this analysis.
What matters for energy positioning: rig count + EIA inventory + OPEC compliance form the supply triangle. When all three move in the same direction (production up + inventory up + compliance loose = bearish), the move usually persists. Today’s mix suggests current supply-demand balance.
Reviewed by analyst before publication. Analysis based on publicly available primary sources.
Frequently Asked Questions
Why did WTI rise this week?
WTI rose $1.78, or 2.5%, to $72.26 after EIA data showed a 1,692 Mbbl crude inventory draw. The stronger signal was that total crude inventory stood at 409,665 Mbbl, 6.3% below the five-year seasonal average.
Are U.S. crude inventories tight or loose right now?
They are tight versus the supplied seasonal yardstick. EIA data show crude inventories at 409,665 Mbbl, which is 6.3% below the five-year seasonal average and 12,497 Mbbl lower year over year.
Which energy stocks benefit most from a tighter WTI market?
Pure upstream exposure such as COP is the cleaner crude-beta read because COP is classified as E&P and trades at $114.71, 15.6% below its 52-week high reference. XOM at $147.36 and CVX at $187.38 also benefit from upstream exposure, but their integrated refining businesses make the read less direct.
Why are refiners VLO and MPC important this week?
VLO at $309.65 is 2.0% above its 52-week high reference, and MPC at $312.60 is 1.4% above its 52-week high reference. That means the market is already rewarding refining economics, so gasoline demand and crack spreads matter more than crude price alone.
What is the key WTI level to watch over the next four weeks?
The key downside level is $70.48, the supplied eight-week low for WTI. Holding above that level while inventories remain below the five-year seasonal average would keep the crude tape supported.
This market commentary is for informational use only. The views expressed are those of the author and do not constitute financial, investment, or trading advice.