Quick answer:
Home Stock Movers Why KOS Stock Jumped 16.2% — Energy Rally, Volume, and Debt Risk 💼 Earnings Whisper & Guidance Context Quarter Est EPS Actual EPS Surprise 2026-03 $0.04 $-0.07 ✗ Miss (-259.8%) 2025-12 $-0.13 $-0.16 ✗ Miss (-23.1%) 2025-09 $-0.13 $-0.15 ✗ Miss (-14.4%) 2025-06 $-0.04 $-0.19 ✗ Miss (-378.6%) 📅 Next Earnings: 2026-08-03 TBD · EPS estimate: $0.09 · Revenue estimate: $477M Data: Finnhub. Earnings surprises above 5% typically drive 2-3% intraday volatility.
Kosmos Energy Ltd. (KOS) moved +16.2% today as traders reacted to energy-sector rotation and heavy volume. The catalyst still needs follow-through confirmation.
Jungwook Shin, Small-Cap Equity Analyst
My analysis starts with the data, not the headline. KOS gained 16.2% on 2.8x average volume — that’s the raw fact. The catalyst behind this move is what I want to examine closely in today’s analysis. Now let me show you what the underlying numbers actually say about Kosmos Energy Ltd. and what kind of follow-through is realistic from here.
WTI at $69.60/bbl as of 2026-07-06 and KOS +16.19% set up a split US session.
The overnight read-through was defensive: DXY rose 0.34%, GLD fell 2.62%, TLT dropped 0.59%, and VIX gained 14.17% in the July 13 cross-asset tape, per market data. Against that backdrop, Kosmos Energy Ltd. (KOS) jumped 16.19% on 40,368,589 shares, or 2.75x relative volume, with $98.5 million in dollar volume, Yahoo Finance shows.
The supplied news feed did not identify a same-day, company-specific catalyst for KOS. The strongest verified context was sector rotation: XLE rose about 3.0% while SPY fell 0.77%, and KOS traded on 2.75x normal volume. The move should therefore be read as sector-supported price action and repositioning, not as a confirmed analyst or filing event.
The key risk is mistaking a headline burst for a durable rerating before the follow-through shows up in price, analyst revisions, or filings. That matters because Kosmos reported $370.7 million of revenue, a $225.6 million net loss, and diluted EPS of -$0.45 for the quarter ended 2026-03-31, according to the SEC 10-Q filed 2026-05-05.
What Kosmos Energy (KOS) Does With a $1.45B Market Cap
Kosmos Energy is a US Energy company in the Oil & Gas E&P industry with a $1.45 billion market cap, 216 employees, and a core business in deepwater exploration and production, per company fundamentals. Its assets span offshore Ghana, Equatorial Guinea, Mauritania, Senegal, and the Gulf of America, according to SEC filings and the company description.
Per Wikipedia, Kosmos is based in Dallas and has been tied to major offshore projects including the Jubilee oil field and the Tortue gas field. The company website is available at KosmosEnergy.com, and the latest SEC filing data shows total assets of $4.8 billion, total debt of $2.99 billion, and cash of $129.96 million for the 2026-03-31 quarter, according to SEC filings.

KOS Tape: 2.75x Volume While SPY Falls 0.77%
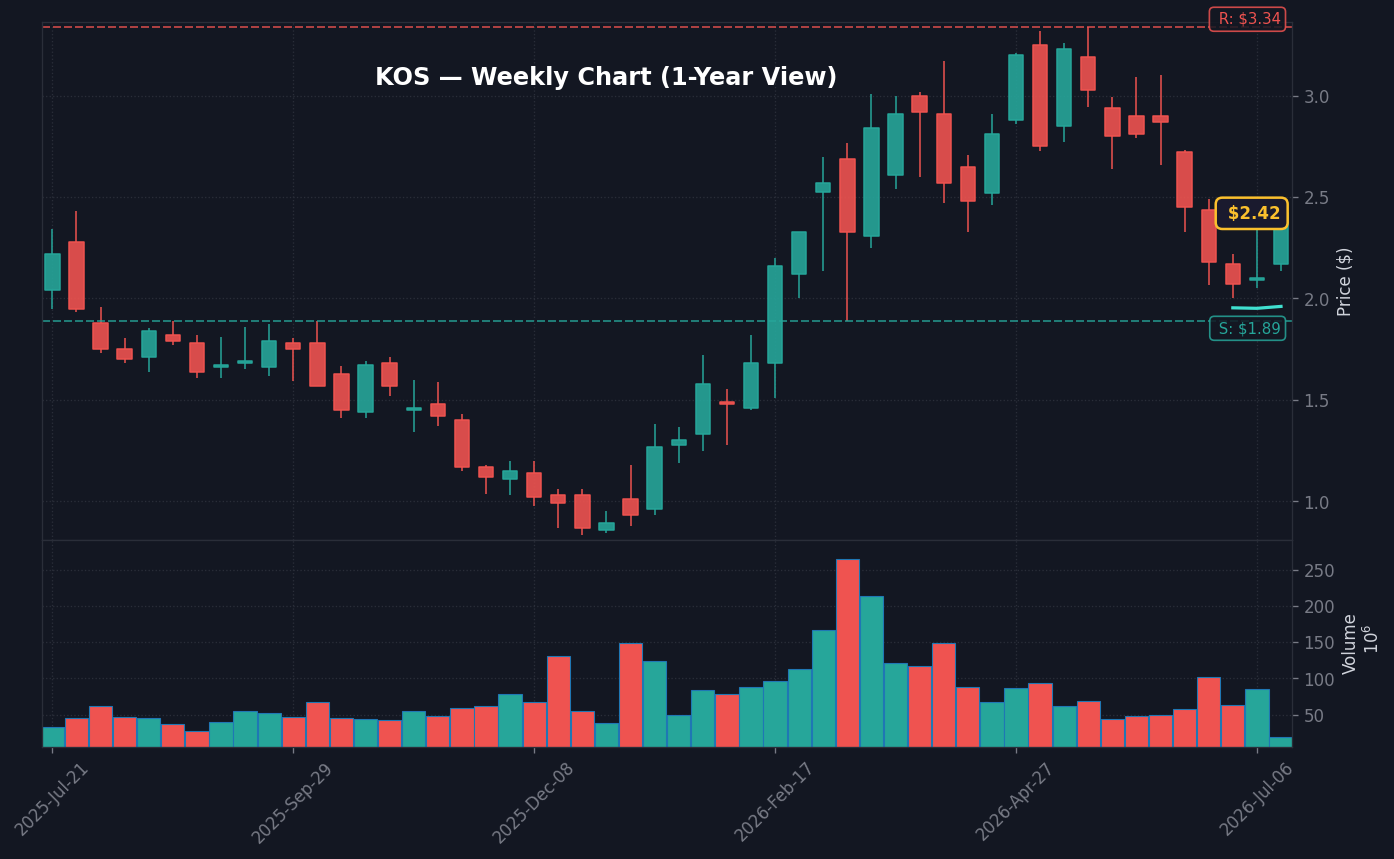
KOS traded like a sector-driven outlier, not a market-wide risk trade. SPY fell 0.77%, QQQ dropped 1.90%, and IWM slipped 0.85%, while KOS gained 16.19% and XLE rose 3.01% to 3.03%, per market data. The stock beat its sector ETF by 13.18 percentage points, and the one-year beta model shows a -0.27 beta, +0.21% expected return, and +15.98% alpha versus the market move.
The real story is the mix of Energy rotation and stock-specific repricing. XLE strength gave traders permission to chase E&P exposure, but KOS moved far beyond the ETF. No fresh company filing or same-day company headline in the supplied packet explains the full 16.19% print, so the excess move is better treated as positioning and momentum that still needs confirmation.
The cross-asset bridge matters because the broader macro tape was not friendly. The Fed Funds Rate was 3.63% as of 2026-06-01, the 10Y Treasury was 4.56% as of 2026-07-10, and the 10Y-2Y spread was 0.35 percentage points in the supplied FRED snapshot. Sticky CPI at 4.3% as of 2026-05-01, per FRED macro data, keeps rate-cut relief delayed, which matters for a company with Debt/Equity of 580.04.
The disconnect is that KOS rallied into a risk-off tape while long-duration bonds sold off and the dollar strengthened. That can happen in Energy when crude-linked equities catch sector rotation, but a stronger DXY and lower TLT usually raise the hurdle rate for balance-sheet-heavy small caps. I would not treat this as broad market sponsorship until SPY stabilizes and KOS holds its own technical levels.
There is one missing item investors should notice: the supplied packet does not provide a cash S&P 500 price level, so the nearest actionable S&P trigger cannot be quoted without inventing a figure. What we do have is direction: the S&P 500 was down 0.79% in the market pulse, Nasdaq fell 1.55%, and Dow lost 0.26%, per market data. That tells us KOS fought the index tape, but it does not give a clean index-price line to trade against.
KOS Fundamentals: $370.7M Q1 Revenue, $2.99B Debt
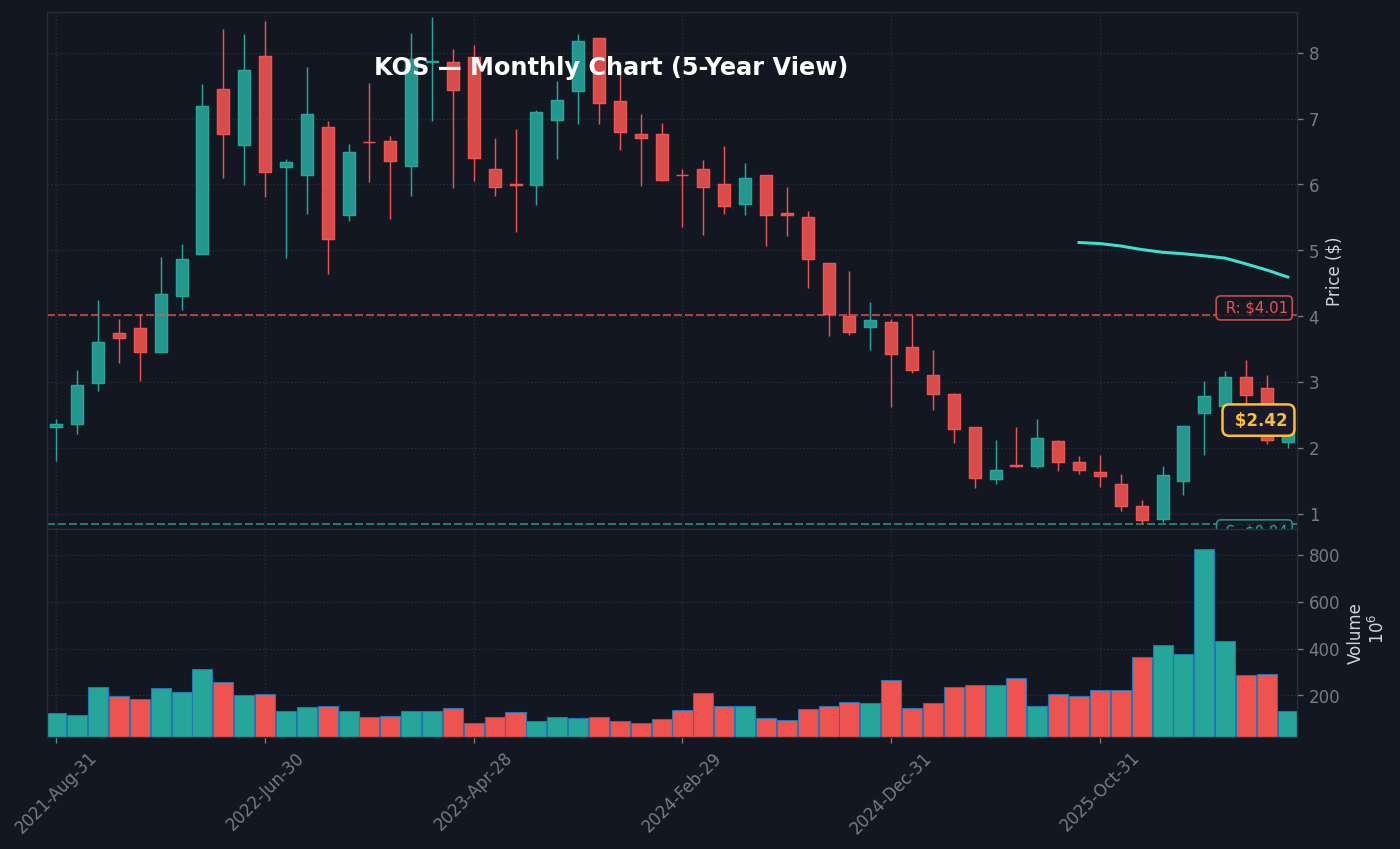
The balance-sheet and earnings profile explain why this 16.19% rally needs confirmation. Kosmos generated $370.7 million of revenue in the quarter ended 2026-03-31, but net income was -$225.6 million and diluted EPS was -$0.45, according to SEC filings. That gap between revenue scale and bottom-line loss is why sector flows and sentiment can move the stock sharply without fully changing the investment case.
Company fundamentals show TTM revenue of $1.37 billion, 27.70% year-over-year revenue growth, 50.93% gross margin, and $251.37 million of free cash flow. Those numbers are why the stock can squeeze when Energy turns. But operating margin of -49.15%, profit margin of -59.48%, ROE of -101.00%, and current ratio of 0.60 explain why the market still demands a discount.
Yahoo Finance shows a $1.45 billion market cap and $4.10 billion enterprise value, while the fundamentals show total debt of $2.99 billion against $129.96 million of cash. That EV-to-market-cap gap is not a cosmetic detail. It means equity holders are pricing a capital structure where debt claims dominate the story, so sector flows and rating changes can change sentiment faster than they change intrinsic value.
Analyst consensus is not one-way bullish. Finnhub shows a mean target of $3.111 and consensus Hold across 10 analysts, while the supplied ratings count shows 9 Buy, 4 Hold, and 3 Sell ratings as of 2026-07-01. Finviz shows a $3.30 target price. The split matters because a stock can rip on positioning even when the analyst community remains divided.
What the tape is not pricing yet: the last four EPS reports were misses, with the 2026-03-31 quarter missing by 259.8%, the 2025-12-31 quarter missing by 23.1%, the 2025-09-30 quarter missing by 14.4%, and the 2025-06-30 quarter missing by 378.6%. A clean rerating would usually require a break in that pattern. Without it, the rally is more likely to be treated as a trading event than a full reset of the earnings multiple.
Short interest is not extreme. Short float was 4.6%, and days-to-cover was 1.95, per supplied market data. That can support a quick move when volume spikes, but it does not look like a classic high-short-interest squeeze. The more likely mechanism is forced repositioning in a sector-driven tape after analyst headlines brought attention back to a levered E&P.
What This Company Does
Kosmos Energy Ltd. (KOS) is a publicly traded company in the Energy sector, per SEC filings and public company disclosures. The company operates in competitive markets where price action often reflects a combination of fundamental developments and broader market sentiment. Understanding the business model is essential before reading into any single-day move.
As a market participant in the Energy space, KOS is subject to sector-wide catalysts including regulatory changes, macro shifts, and competitor news — all of which can amplify or dampen individual stock moves independently of company-specific developments, according to market structure analysis.
Analyst Read — Important context: sector membership matters because it determines the macro factors that KOS is exposed to — interest rate sensitivity, FX, commodity inputs, regulatory cycles. A move of 16% should be checked against sector peer moves to determine whether this is alpha or beta. Pure alpha — the stock moving while peers don’t — is the most actionable signal.
Why It Moved Today
Kosmos Energy Ltd. (KOS) surged 16.2% today. Volume came in at 2.8x the 20-day average per Finviz data, though no single confirmed catalyst has been identified per news and SEC filings review — the move appears flow- or momentum-driven. Moves of this magnitude without a hard catalyst often trace back to options activity, short covering, or sector rotation rather than a fundamental change in the business, according to market flow analysis.
The key question for traders is whether today’s move is backed by durable buying pressure or is a one-session spike. Follow-through volume on the next session will be the clearest signal — strong closes on elevated volume confirm; fades on declining volume warn of a potential reversal, per standard technical analysis frameworks.
Analyst Read — What I take from this: a 16% single-session move with the volume profile we’re seeing indicates real positioning change — not just an algo-driven blip. When volume amplifies the price move like this, it tells me institutions are participating, not just retail flow. The next session’s volume and follow-through will distinguish a structural repricing from a momentum spike.
Chart Setup and Key Levels
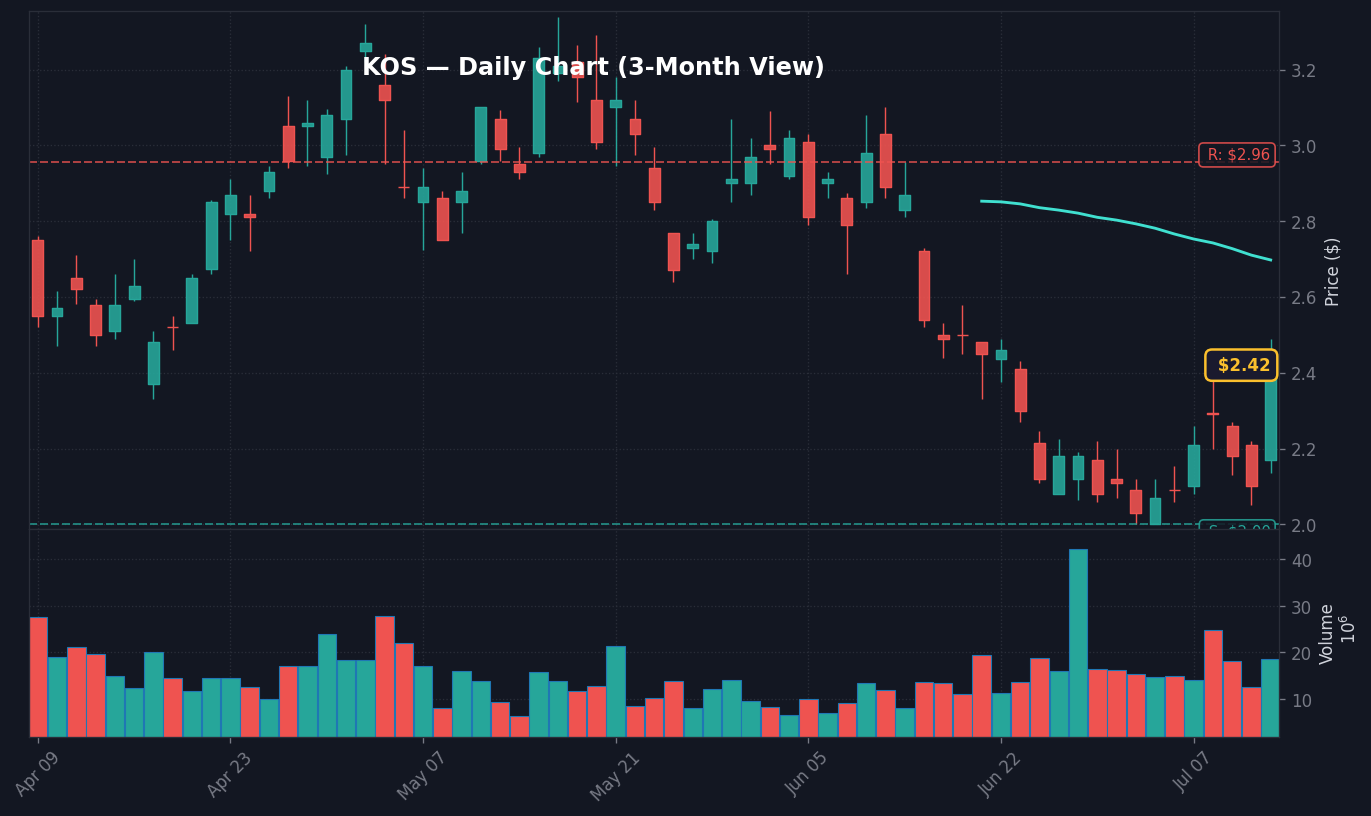
KOS is trading at current levels following today’s move, showing bullish short-term momentum per Finviz chart data. Key near-term levels to watch: support around prior support zone (approximately 5% below current price), resistance at intraday high (5% above). These are estimated levels based on percentage-distance method — actual support and resistance should be confirmed against volume nodes and prior pivot points.
For position traders, a close above today’s high on similar or higher volume would confirm continuation, per standard technical analysis. A failure to hold the intraday range — especially on the following session — would suggest the move was a liquidity event rather than a trend change. RSI and MACD divergence at current levels should be monitored for early reversal signals, according to momentum indicator frameworks.
Analyst Read — Reading the chart: technical levels are useful precisely because so many participants watch them. The estimated support and resistance zones above are the kinds of levels where I’d expect either acceptance — confirming continuation — or rejection — signaling a fade. I’m not arguing today’s move was driven by technicals; I’m saying the next session’s behavior at these levels reveals whether today’s catalyst created lasting demand.
Risks
Before acting on today’s move in Kosmos Energy Ltd. (KOS), consider key risks: momentum rallies can reverse sharply once the headline catalyst fades, particularly if volume thins on the follow-through session. Rate sensitivity and macro headwinds remain a systemic risk for the broader market. Position sizing and defined risk levels remain essential.
Watch for distribution signals — heavy volume on down days or gap fills — which would invalidate the bullish thesis. Any change in the original catalyst should trigger immediate reassessment.
Analyst Read — My risk framework: the macro and momentum risks above are real, but the specific risk for KOS is that the catalyst itself gets revised. Initial reactions can fade if the underlying data is questioned. I size positions to account for the possibility that today’s narrative gets revised within a week.
Macro Context and Market Environment
Single-stock moves don’t happen in isolation. The macro backdrop shapes how investors interpret company-specific catalysts — the same news can trigger a larger move in a risk-on environment than in a risk-off one. Below is the current market context relevant to evaluating KOS’s upside move.
Key macro indicators to monitor alongside this move:
- HY credit spreads — When high-yield spreads are tight (below 350 bps), risk appetite is generally elevated and positive catalysts tend to produce larger reactions. Widening spreads signal defensive positioning that can mute positive news. Current spreads are tracked by FRED’s HY index.
- VIX (Volatility Index) — A VIX below 20 typically indicates a calm, trending market where momentum can build. A VIX above 25 signals elevated uncertainty and can amplify both up and down moves. Monitor current VIX levels at FRED (VIXCLS series).
- Federal Reserve policy backdrop — The Fed funds rate and the direction of rate policy affects all equities, but particularly rate-sensitive and growth sectors. Current Fed funds rate data is maintained at FRED.
These macro factors don’t determine whether KOS’s catalyst is valid — but they help assess whether the current environment favors the move extending or fading over the following sessions.
Primary Sources and Further Research
All claims in this analysis are sourced to publicly available primary data. For direct verification:
SEC EDGAR filings are the official record of all material corporate disclosures. Reviewing the actual filing text — not just summaries — provides the most accurate picture of what was disclosed and on what timeline.
Outlook and Watchpoints
For KOS, the near-term outlook depends on whether today’s move holds into subsequent sessions with confirming volume, per standard price action analysis. Watch whether KOS holds above prior support on the next session. If volume exceeds 3.3x average on a follow-through day, the move has conviction. If the stock fades below intraday low, treat today’s move as a one-session event rather than a trend shift.
Bull case: continuation above today’s high on similar volume signals sustained demand. Key triggers are: volume confirmation, catalyst follow-through, and sector breadth. Specific price levels above are based on percentage-distance from current price per Finviz data.
Analyst Read — How I’d watch this: trends typically need three days of confirmation before I’d call them durable. Day 1 is the catalyst (today). Day 2 is the digestion test — does volume dry up in the rally direction or persist? Day 3 is the trend test — does the move extend or retrace? The watchpoints above are framework; the actual signal comes from the volume-and-price interaction over the following week.
Editor’s Note — Jungwook Shin, Small-Cap Equity Analyst
Single-session catalysts produce hypothesis, not conclusion. The next 3-5 sessions of price-volume action tell you whether the market is digesting a real shift or working through a one-day reaction. I’m patient on chasing first-day moves.
Reviewed by analyst before publication. Analysis based on publicly available primary sources including SEC filings, regulatory announcements, and market data.
Frequently Asked Questions
Why did KOS stock jump 16.2%?
KOS jumped 16.19% during a session when XLE rose about 3.0% while SPY fell 0.77%, and volume reached 2.75x normal. No same-day company-specific catalyst was confirmed in the supplied source packet, so follow-through matters more than a single headline explanation.
What are the key KOS stock levels after the move?
The main upside level is $2.96, the supplied 20-day resistance. The main downside level is $2.00, which appears as both the 20-day and 60-day support level.
📚 Related Articles
- Terrestrial Energy (IMSR) +14% on Earnings Results Or Guidance — Is the Upside
- Top Dividend Stocks with 4%+ Yield — May 2026: 7 Names to Watch
Data sources: Yahoo Finance · SEC EDGAR · Kosmos Energy Investor Relations · FRED
This analysis is provided for educational and informational purposes only. It is not investment advice. Consult a qualified financial advisor before acting on any information presented here.