S&P 500 Gains 0.26% to 7041.28 as Rotation Gains Traction
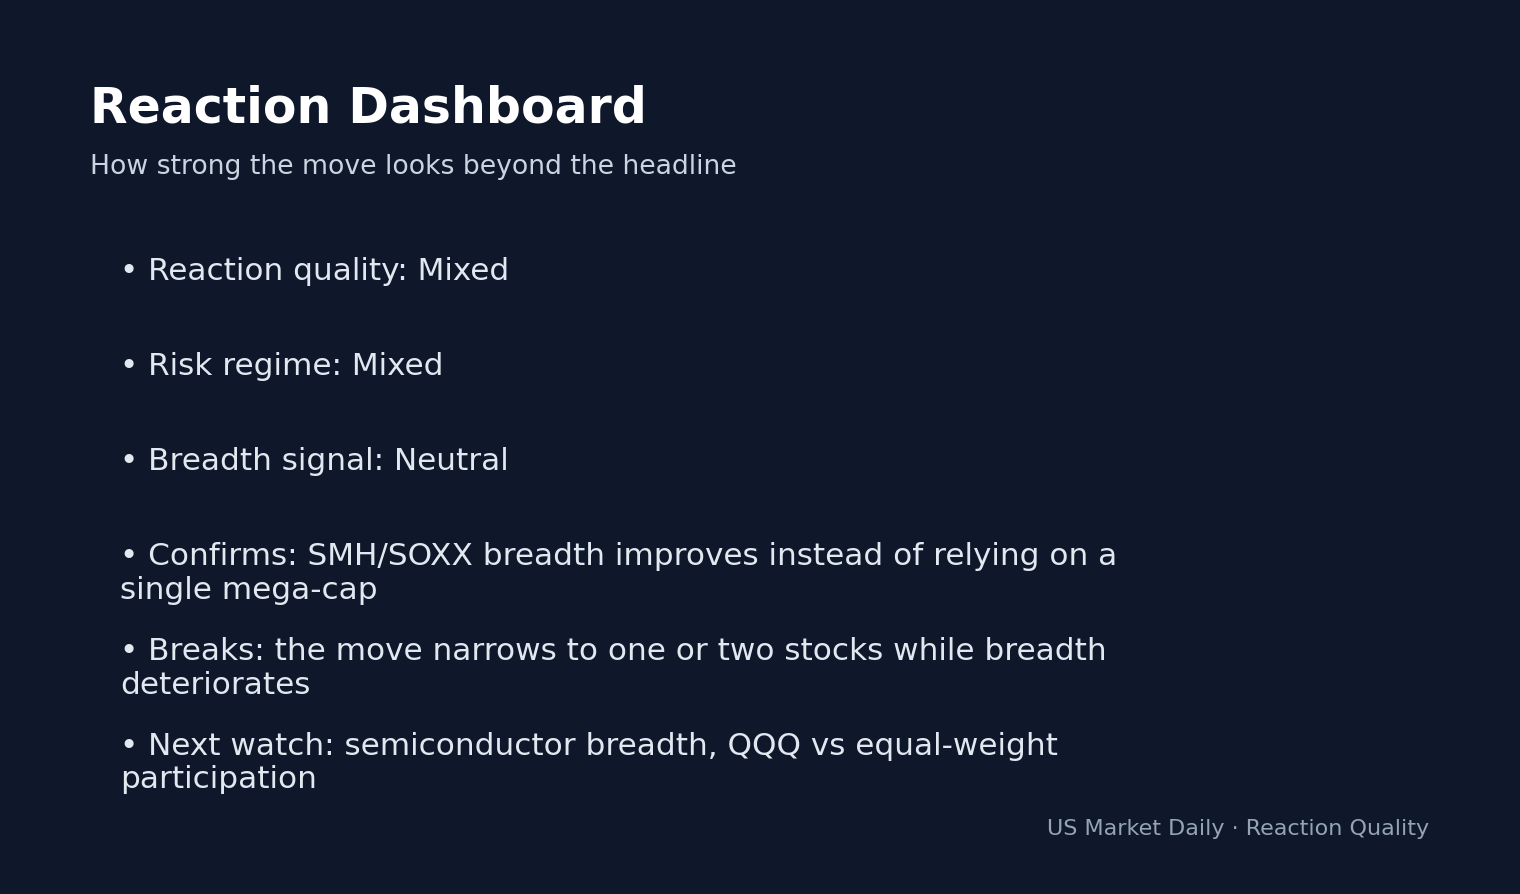
Reaction dashboard card showing whether the move looks broad, fragile, or mixed. · Generated in-house
The S&P 500 closed the April 16, 2026 session 0.26% higher at 7,041.28. This move reinforces the resilience of the domestic equity market despite the index’s 14-day Relative Strength Index (RSI) reaching an elevated 83.32, per real-time market data. Institutional capital flows are aggressively rotating into high-beta technology names and energy producers. These inflows cushion the broader index against profit-taking in the healthcare and financial sectors.
Per exchange data, the Nasdaq Composite similarly outperformed, advancing 0.36% to 24,102.7 as demand for high-growth tech assets persisted through the closing bell. Persistent buying in semiconductor and software sub-sectors confirms that liquidity remains deep, notwithstanding the 10-year Treasury yield climbing 0.63% to 4.31% during the same window. The disconnect between rising yields and the equity risk premium continues to widen, which shows investors prioritize earnings growth over the mechanical pressures of fixed-income repricing.
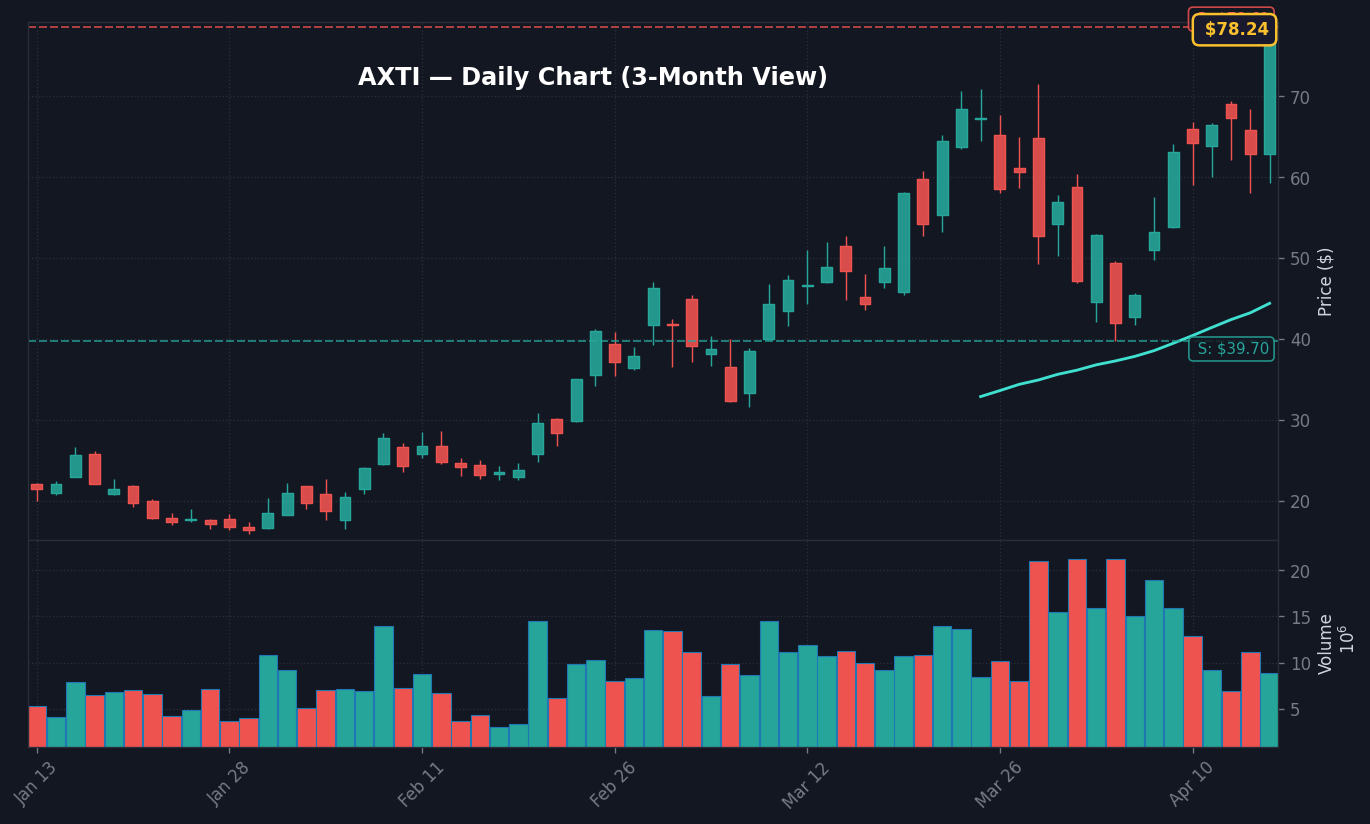
AXTI Daily Chart — 3-month view with SMA50/200
The fragility of the current technical structure remains the primary takeaway. The 50-day moving average sits at 6,764.28, meaning the index remains significantly extended above this mean. This gap creates mechanical vulnerability if the positive sentiment in tech should stumble. Small cap volatility and heavy buying in high-beta tech mask a lack of broad-based participation in defensive sectors, according to sector-level volume analysis.
Energy and Tech Lead: A Divergent Market Regime
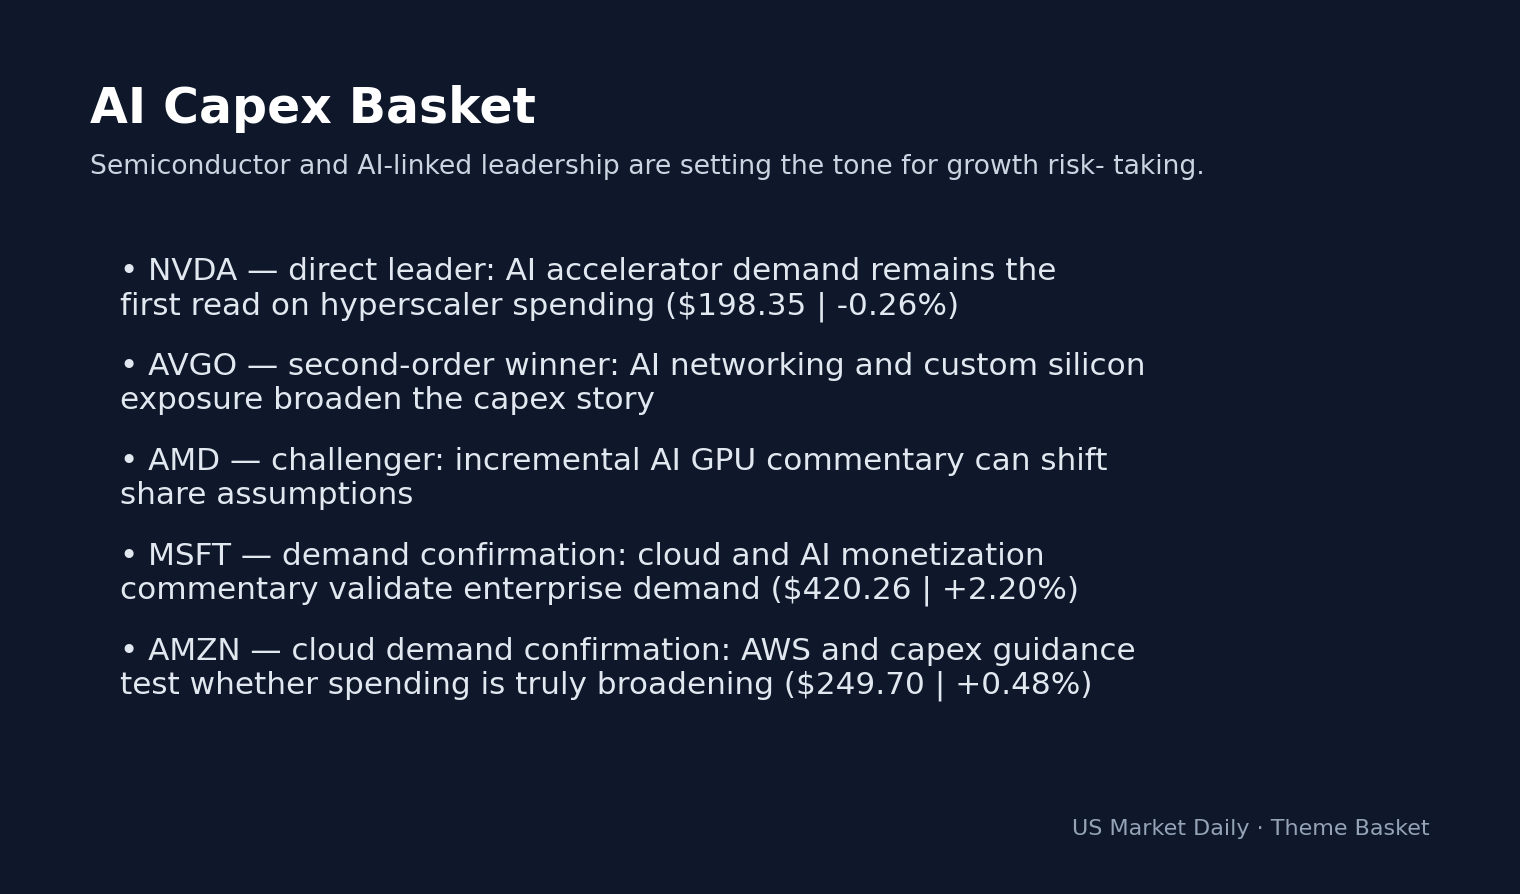
Source: Insider MonkeyTheme basket card mapping the current market setup into the most relevant stocks. · Generated in-house
The Energy sector surged 1.47% due to shifting supply narratives and sector-specific inflows. Data from FactSet indicates that energy outperformed both the broader index and defensive staples, which gained only 0.46%. This rotation reflects hedging behavior against inflationary pressures that the bond market has started to price in, as evidenced by the 10Y-2Y yield spread sitting at 0.53pp.
Technology fueled the index-level gains with a 1.14% sector advance. This was supported by price action in semiconductor components. According to Finnhub, ON Semiconductor (ON) gained 10.35% and Dell Technologies (DELL) climbed 8.92%, illustrating a focused appetite for AI-exposed hardware. The market views these hardware providers as the primary beneficiaries of continued AI capital expenditure, even as the 3.64% Fed Funds Rate creates high hurdle rates for less efficient enterprises.
Technical Setup: DELL and ON Semiconductor Drive Momentum
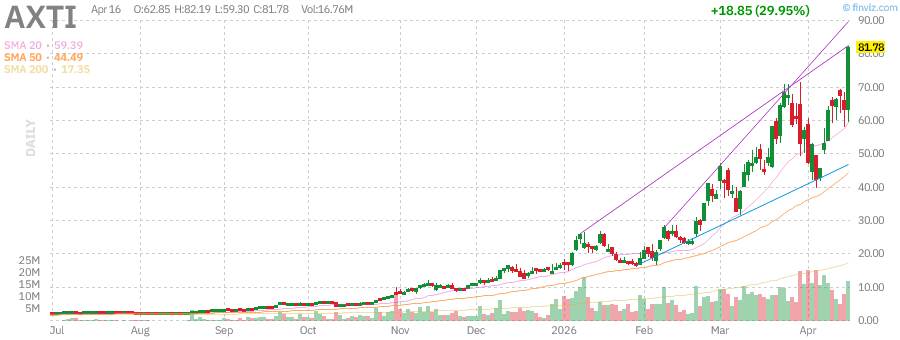
AXTI daily chart with SMA 20/50/200 and volume — source: Finviz, April 17, 2026 · Chart: Finviz
Dell (DELL) closed at 193.09, representing an 8.92% gain on the day, while ON Semiconductor (ON) surged to 79.93, a 10.35% appreciation, per market pricing data. Significant retail and institutional participation in the semiconductor supply chain sustains these moves. The relative strength of these hardware plays outpaces broader software indices, which have seen more tepid inflows over the last 48 hours.
Technical indicators for these tickers flash extreme optimism. Recent parabolic moves in AXTI, which gained 29.95%, and XNDU, which rose 29.75%, indicate unconstrained risk appetite. Traders should note that the volume-weighted average price (VWAP) in these leaders is drifting far from the day-open. Late-session buying remains vulnerable to standard mean reversion at the start of tomorrow’s session. Market data indicates that profit-taking in these high-flyers triggers a rapid cooling effect on the Nasdaq 100 futures if they break below key intraday support levels.
Scenario Analysis: Bull and Bear Cases for S&P 500
The bull case relies on the S&P 500 maintaining its hold above the 7,000 index level. If the index sustains a close above 7,050, it triggers a technical breakout toward 7,150, fueled by short-covering from market participants who missed the initial rally. This scenario holds if the 10Y Treasury yield stabilizes below 4.35%, reducing discount-rate pressure on high-multiple growth stocks.
The bear case rests on a failure of the 6,980 level. If the index slips below 6,980, the technical overextension signaled by the 83.32 RSI leads to a correction back toward the 6,850 zone. The current rotation out of Financials, which saw a 0.27% decline today, signals a potential shift into defensive positioning. High market beta exacerbates downside velocity in a correction because liquidity thins out during downward momentum swings, based on historical volatility patterns.
Key Thresholds: 7,000 Support & 4.40% Yield Cap
Watch whether the S&P 500 maintains the 7,000 level during the first hour of trading tomorrow; a breach below this confirms exhaustion of current momentum, while a hold at 7,000 invalidates the immediate reversal setup.
Key level: 4.31% on the 10Y Treasury yield; if this pushes toward 4.40%, it acts as a structural headwind for tech valuations.
If the Nasdaq 100 fails to hold its current support at 26,400, a test of 26,000 occurs in the subsequent 48 hours.
Trigger: Watch upcoming jobless claims and regional manufacturing data releases later this week to define the narrative for the next Fed interest rate trajectory.
Next Session Watchpoints
Volume profile: Watch whether AXTI keeps at least 1.7x average.
Key level to watch: Use today’s nearest actionable S&P 500 level from the supplied technicals and explain why it matters. is the pivot for continuation.
Catalyst quality: The move needs follow-through headlines or clean price acceptance above the pivot.
Risk trigger: If AXTI loses the opening range quickly, the move shifts from continuation to fade risk.
Frequently Asked Questions
Why is the market moving right now?
The market is moving due to a rotation into AI-linked hardware and energy stocks, which drove the S&P 500 up 0.26% despite higher Treasury yields. This move is fueled by strong institutional demand for semiconductor names, which are outpacing the broader, more defensive sectors.
What should investors watch next?
Investors should monitor the 7,000 support level on the S&P 500 and the 10Y Treasury yield, currently at 4.31%. A failure to hold 7,000, combined with a rise in bond yields, would likely signal a potential correction given the current overbought RSI of 83.32.
How did bond yields impact tech stock performance?
Despite the 10Y Treasury yield rising 0.63% to 4.31%, the technology sector rallied 1.14%. This suggests the market is prioritizing earnings growth and AI-driven capex trends over the mechanical pressure of rising discount rates.
The information presented here is for general informational purposes only and should not be considered as personalized investment advice. All investing involves risk.
📊 Data Sources
yfinance · FRED (St. Louis Fed) · SEC EDGAR · Finnhub · World Bank · Wikidata
Last Updated: 2026-04-17 06:24 KST
This analysis uses public data sources. Investment decisions are your own responsibility.
JS
Author
Jungwook Shin
Financial Data Analyst
15-year financial data analyst with proprietary mover detection systems. Real-time catalyst analysis across US, Korea, and Japan markets.
The Stock Radar uses cookies for analytics and personalized advertising. By continuing to use our site, you accept the use of these cookies. See our Cookie Policy and Privacy Policy.