Market SnapshotAs of 2026-07-27 23:54 ET (intraday change)
S&P 500
$738.64
◆ -0.04%
Nasdaq 100
$679.99
▼ -0.62%
Russell 2000
$292.66
▲ +0.51%
VIX
19.53
▲ +5.11%
US 20Y
$83.54
▲ +0.35%
Dollar
101.50
◆ +0.02%
Gold
$373.76
▲ +0.50%
No overnight global-market move was supplied; by 10:51 AM ET on July 27, the S&P 500 was down 0.12% at 7,402.91 while the Nasdaq Composite fell 0.42%, the Dow Jones rose 0.37%, and the VIX jumped 5.01% to 19.51, per Market Data.
This is a high-priority market alert because the first-order consequence is not a clean equity selloff; it is a rotation map. Communication Services gained 1.48%, Consumer Staples rose 1.33%, and Financials added 0.99%, while Technology dropped 1.58% and Energy fell 1.71%, per Market Data. The tape is telling us that traders are reducing exposure to the most rate-sensitive and positioning-heavy sleeves while still buying defensive cash flow and selected cyclicals.
The risk is that traders mistake the first knee-jerk move for the full-market message before liquidity and confirmation arrive. The nearest actionable S&P 500 level is 7,471.21, the 50-day simple moving average, because Market Data shows the index below that line with RSI at 40.73 and MACD at -4.5055 versus a 11.37 signal line. In a sticky-CPI regime, that failed 50-day reclaim matters because upside needs both lower volatility and proof that Technology selling is not broadening.
How Did VIX at 19.51 Change the July 27 Market Map?
VIX at 19.51 changes the message because it is up 5.01% intraday and above the 18.6 VIX reading in the macro snapshot, while that same snapshot puts the 20-day average at 16.8, per FRED data and Market Data. The move says traders are paying for protection even though the S&P 500 loss is still shallow.
The cross-asset bridge is important: the 10-year Treasury yield is 4.66%, down 0.47% on the session, while the latest FRED snapshot showed the 10-year at 4.71% with a 5-day change of +16 basis points as of July 23. Falling yields would normally help long-duration equities, but the Nasdaq is still down 0.42%, per Market Data. That disconnect says the pressure is not just rates. It is positioning, factor crowding, and a volatility reset.
The overlooked signal is that the market is not rejecting all risk. S&P 500 futures were flat at 7,438.5, Nasdaq 100 futures were flat at 28,030.0, and Dow futures were flat at 52,379.0, per Market Data. The cash market is where the stress is visible, and that raises the value of confirmation after the first hour rather than extrapolating from a single volatility spike.
The sticky inflation backdrop still constrains the bull case. Fed funds were 3.63% as of June 1, CPI was 3.7% year over year as of June 1, and unemployment was 4.2%, per FRED data. That mix does not give equities a clean policy-relief story. If volatility cools, the index can stabilize. If inflation keeps cuts delayed, the multiple-sensitive parts of Technology may need more than a lower 10-year yield to recover.
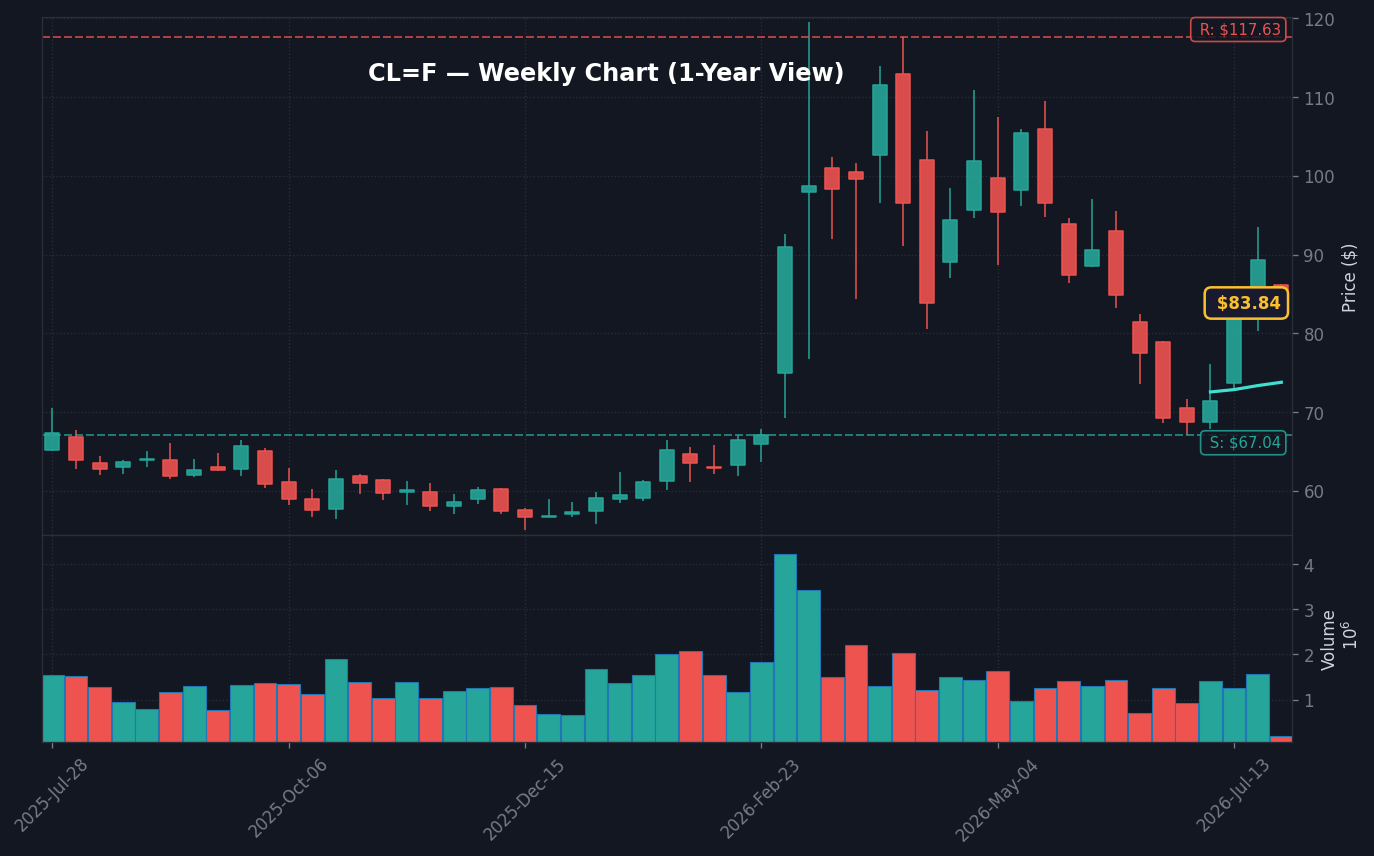
CL=F Weekly Chart — 1-year view with SMA50/200
LVWR +82.88% Shows Speculation Has Not Fully Broken
LVWR jumped 82.88%, GENI gained 12.58%, BMNR rose 11.11%, ASAN gained 10.71%, and RHI added 8.22%, per Market Data. Those numbers matter because a market that is truly de-risking across the board usually does not leave this much appetite for single-name momentum.
The speculative pocket is narrow but real. Software and application names also showed relative strength, with WDAY up 7.74%, TEAM up 7.54%, SHOP up 7.58%, HUBS up 7.37%, PEGA up 7.59%, and RNG up 6.73%, per Market Data. Since no company-specific catalyst was supplied for those moves, the clean interpretation is relative strength rather than confirmed fundamental news.
Worth noting: the upside list and downside list are both full of large moves. That is a volatility regime, not a sleepy tape. LEGN dropped 14.49%, MXL lost 10.80%, and SNDK fell 11.13%, per Market Data, while LVWR rose 82.88%. The market is rewarding immediacy and punishing crowded exposures, which means headline readers need to separate index calm from single-name violence.
Why Does the 4.66% 10Y Matter for QQQ Risk?
The 4.66% 10-year yield matters because it is not giving the Nasdaq enough relief: the yield is lower on the session, but the Nasdaq Composite is still down 0.42%, per Market Data. With CPI at 3.7% and Fed funds at 3.63%, per FRED data, sticky inflation keeps the policy ceiling over growth equities.
The curve also matters. The 2-year Treasury yield was 4.37%, and the 10-year minus 2-year spread was 0.34 percentage points, per FRED data. That is not the shape of a market aggressively pricing immediate easing. It is a curve that gives banks some help, which fits Financials up 0.99%, but it does not automatically rescue long-duration Technology.
The Dollar Index broad measure was 120.53 with a 5-day move of -0.17%, per FRED data. That small dollar easing is not the main equity driver today. The stronger signal is the VIX move to 19.51 against the S&P 500 at 7,402.91, per Market Data, because protection demand is rising while the index is still near the 50-day decision zone.
Counterintuitively, lower yields and a weaker 5-day dollar are not enough for a risk-on call. In a sticky-CPI regime, traders need evidence that lower yields are coming from benign inflation expectations rather than growth concern or defensive demand. The data supplied does not include breakeven inflation, TIPS, HY OAS, or MOVE index readings, so the article should not pretend to have that confirmation.
S&P 500 7,471.21 Is the July 27 Line
The S&P 500 is at 7,402.91, below its 50-day simple moving average of 7,471.21, per Market Data technical indicators. RSI is 40.73, MACD is -4.5055, the MACD signal is 11.37, the Bollinger Band position is inside, and there is no MACD crossover, per the same technical snapshot.
This is the cleanest actionable level because it separates a routine intraday wobble from a failed trend reclaim. A move back above 7,471.21 would show buyers can absorb the VIX spike and Technology drawdown. Failure below that mark leaves the S&P 500 under its 50-day average while the Nasdaq remains the weaker index.
The tape is telling us to watch confirmation, not drama. The current S&P decline is only 0.12%, but the sector dispersion is wide enough to matter: Communication Services at +1.48% and Consumer Staples at +1.33% sit far away from Technology at -1.58% and Energy at -1.71%, per Market Data. That is the market map of a portfolio rotation, not a one-line index story.
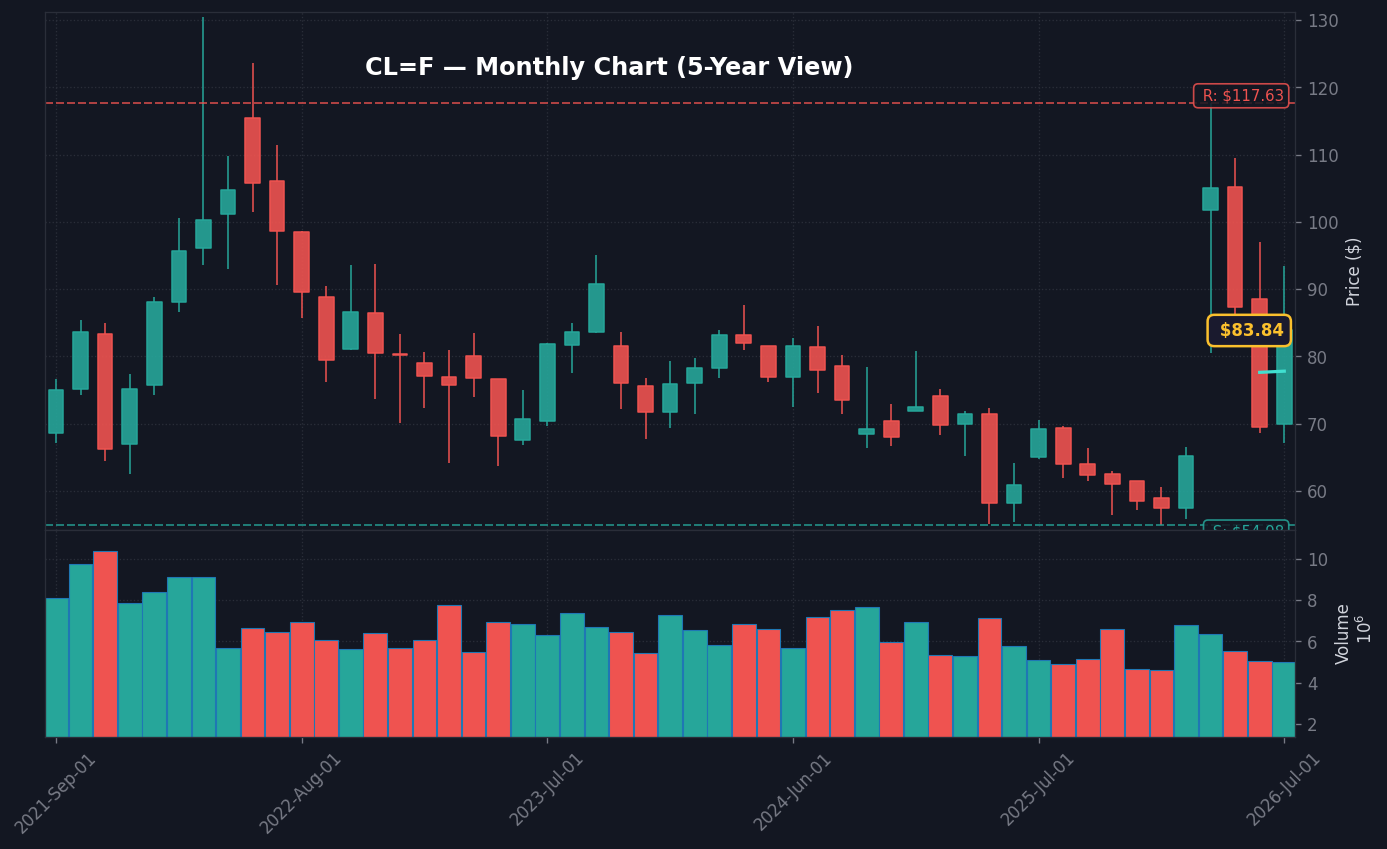
CL=F Monthly Chart — 5-year view with SMA50/200
3 Scenarios for S&P 500 7,471.21 by the July 27 Close
Bull: The S&P 500 reclaims 7,471.21 by the July 27 cash close, VIX fades from 19.51 toward the 18.6 macro snapshot level, and Nasdaq damage narrows from the current 0.42% decline, based on Market Data and FRED data. That would turn the first alert into a failed volatility spike rather than a trend break.
Base: The S&P 500 trades between 7,402.91 and 7,471.21 through the afternoon while RSI stays near the supplied neutral 40.73 reading, per Market Data technicals. This is the most information-light outcome because it confirms neither a 50-day reclaim nor a decisive downside break.
Bear: The S&P 500 loses the 7,402.91 live level while VIX holds at or above 19.51 and Technology remains near the supplied -1.58% sector loss, per Market Data. No lower S&P support level was supplied, so the honest bear trigger is a break of the live print plus volatility confirmation, not an invented downside target.
The asymmetry is tight but clear. Bulls need one level, 7,471.21, and one volatility confirmation, a VIX retreat from 19.51. Bears need breadth to deteriorate beyond Technology and Energy because the Dow is still up 0.37% and Staples are still up 1.33%, per Market Data. The next trade is not about guessing the headline. It is about whether the market accepts or rejects the 50-day average.
What Should Investors Watch After VIX 19.51?
The clean watchpoint is whether VIX retreats from 19.51 while the S&P 500 pushes back toward 7,471.21, the 50-day simple moving average, per Market Data technicals. If volatility stays firm and Technology remains down near 1.58%, the market alert stays active into the July 27 close.
The next confirmation is time-based because no official event trigger was supplied with the alert. The 4:00 PM ET US cash close on July 27 will show whether the 10:51 AM ET move was a fast rotation or the opening phase of a broader de-risking.
What to Watch: S&P 500 7,471.21
Watch whether the S&P 500 can reclaim the 7,471.21 50-day simple moving average while VIX retreats from 19.51
Key level: 7,471.21, the S&P 500 50-day simple moving average, with the index last at 7,402.91
If the S&P 500 stays below 7,471.21 and Technology remains down near 1.58% then the July 27 market alert remains a rotation-risk signal rather than a harmless index dip
Trigger: July 27, 2026, 4:00 PM ET US cash close; no official release trigger was supplied
Next Session Watchpoints
Volume profile: Watch whether THE STOCK keeps at least follow-through volume versus normal.
Key level to watch: Use today’s nearest actionable S&P 500 level from the supplied technicals and explain why it matters. is the pivot for continuation.
Catalyst quality: The move needs follow-through headlines or clean price acceptance above the pivot.
Risk trigger: If THE STOCK loses the opening range quickly, the move shifts from continuation to fade risk.
Frequently Asked Questions
Why did the S&P 500 slip on July 27 while the Dow rose?
The S&P 500 was down 0.12% at 7,402.91 while the Dow gained 0.37%, per Market Data. The split came from sector rotation: Technology fell 1.58% and Energy lost 1.71%, while Communication Services rose 1.48% and Consumer Staples gained 1.33%.
Is the VIX move to 19.51 a risk-off signal for July 27?
VIX rose 5.01% to 19.51, per Market Data, which shows traders paying more for protection even though the S&P 500 decline was only 0.12%. The signal becomes more serious if VIX holds near 19.51 while the S&P 500 remains below its 7,471.21 50-day simple moving average.
What S&P 500 level matters most after the July 27 market alert?
The key S&P 500 level is 7,471.21, the 50-day simple moving average from Market Data technical indicators. A reclaim would soften the volatility alert; failure below that line keeps the index under trend pressure with RSI at 40.73 and MACD at -4.5055.
This market commentary is for informational use only. The views expressed are those of the author and do not constitute financial, investment, or trading advice.