🇺🇸 US Market CLOSED Thu, Jul 16 · 11:21 PM EDT
Data: SEC · EDGAR · FRED · Yahoo Finance
MARKET PULSEDELAYED
S&P 500 7,544.38 +0.01% Nasdaq 26,130.71 +0.09% Dow 52,552.94 +0.09% VIX 16.18 -1.94% Gold 4,040.40 -0.72% US 10Y 4.55% +0.00%

Terrestrial Energy (IMSR) +14% on Earnings Results Or Guidance — Is the Upside

IMSR technical chart with RSI, MACD, Bollinger Bands
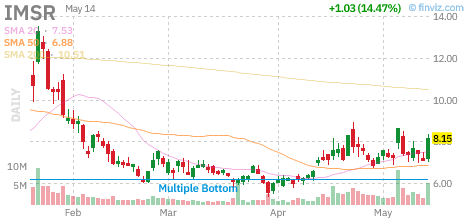
IMSR daily chart with SMA 20/50/200 and volume — source: Finviz, May 15, 2026 · Chart: Finviz

IMSRTerrestrial Energy Inc.
$8.15▲ +14.47%

Utilities · Utilities – Regulated Electric

Volume5.7M
Avg Volume2.1M
Market Cap$1.1B
Catalystearnings results or guidance

IMSR surged 14.5% today. Here’s what drove the move and what the technicals show.

Terrestrial Energy Inc. (IMSR) shares popped 14.47% today, driven by the release of its Q1 earnings call highlights, which centered on shifting the company toward full execution mode. The move is significant: the stock advanced on massive 2.71x relative volume, showing institutional re-rating of the firm’s progress in Generation IV nuclear technology. The move reflects a clear catalyst, but the company’s lack of TTM revenue means gains require sustained momentum to stick.

Q1 highlights (per the 8-K filed 2026-05-14) signaled a path forward for the reactor technology. With no TTM revenue, today’s +14.47% jump is sentiment-driven on development timing, not earnings fundamentals—typical for pre-revenue utility-tech plays.

What This Company Does

Terrestrial Energy Inc. is a U.S.-based nuclear technology company headquartered in Charlotte, North Carolina. It specializes in the development of Generation IV nuclear technology designed to produce cost-competitive, high-temperature thermal energy with zero emissions, per Wikipedia.

The company operates within the Regulated Electric utility sector but functions more like a technology incubator, offering pre-construction site selection, engineering studies, and component supply for its proprietary Integrated Molten Salt Reactor (IMSR) units. With a market cap of $1.06 billion, it remains a volatile, high-beta play on the future of base-load carbon-free energy.

Takeaway: Terrestrial Energy is a specialized, pre-revenue developer of advanced molten salt nuclear reactor technology.

Why It Moved Today

The primary driver for today’s +14.47% surge is the market’s reaction to the “Terrestrial Energy Q1 Earnings Call Highlights” reported by MarketBeat. The catalyst is a confirmed pivot to execution, suggesting investors are finally pricing in a transition from theoretical research to tangible site-specific licensing and engineering contracts.

IMSR moved independently of broader markets. While the S&P 500 (+0.79%) and utilities sector (+0.51%) gained, IMSR’s +13.96% alpha shows this was stock-specific, not sector-driven. Buyers targeted IMSR on its operational update: $297.79M in cash funds near-term execution.

MetricValue
Trailing EPS$-0.39
Forward EPS$-1.04
Revenue (TTM)N/A
Gross Margin0.00%
Terrestrial Energy Q1 Earnings Call Highlights
Source: MarketBeat

Takeaway: The catalyst is a confirmed pivot to execution, boosting investor conviction in the development timeline.

Chart Setup and Key Levels

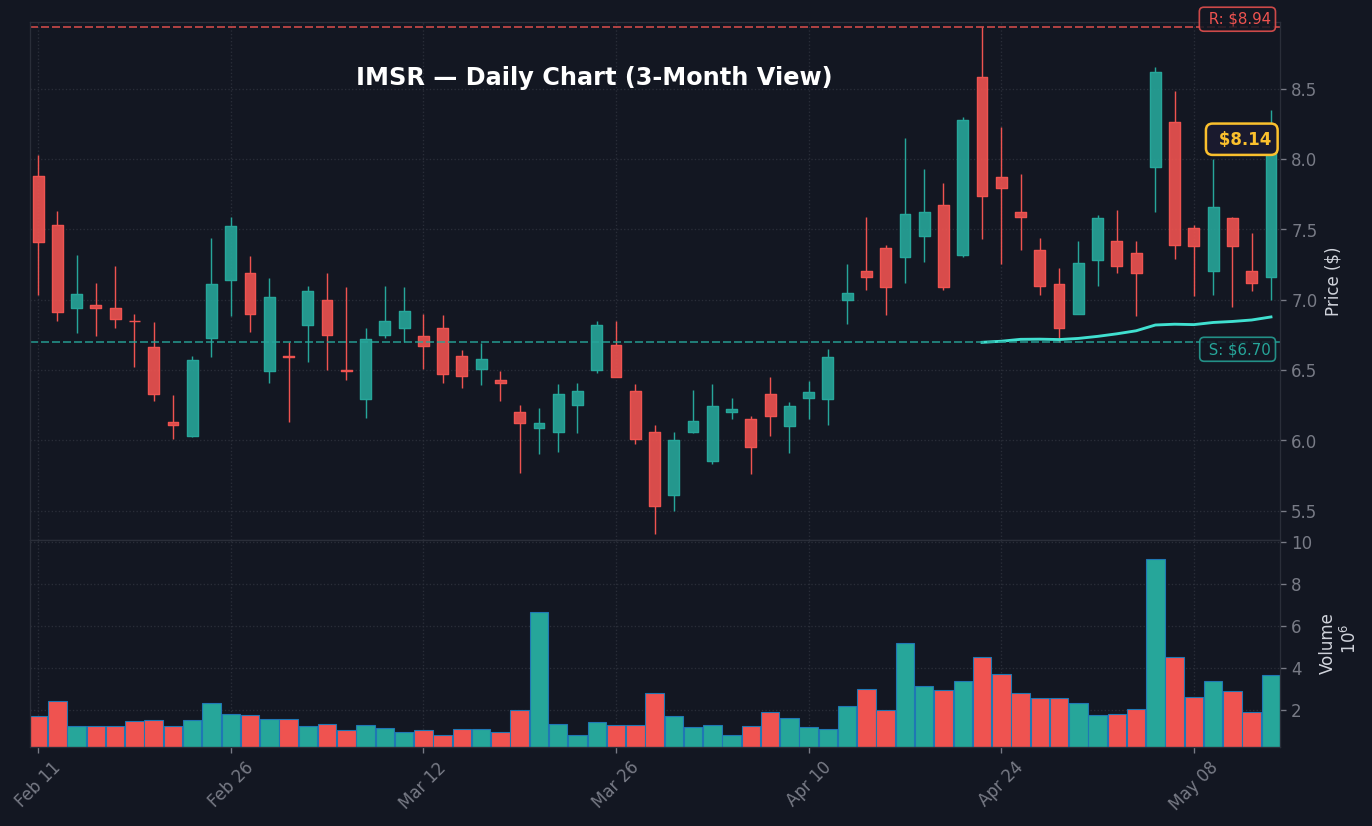
The daily chart shows the stock reclaiming its position above the 50-day SMA, which sits at $6.88. With an RSI of 52.66, the stock is currently in neutral territory, suggesting that despite the 14.5% jump, there is still technical room for the rally to extend before hitting overbought conditions. The upper Bollinger Band sits at $8.41, which serves as the primary immediate resistance.

IMSR Daily Chart — 3-month view with SMA50/200

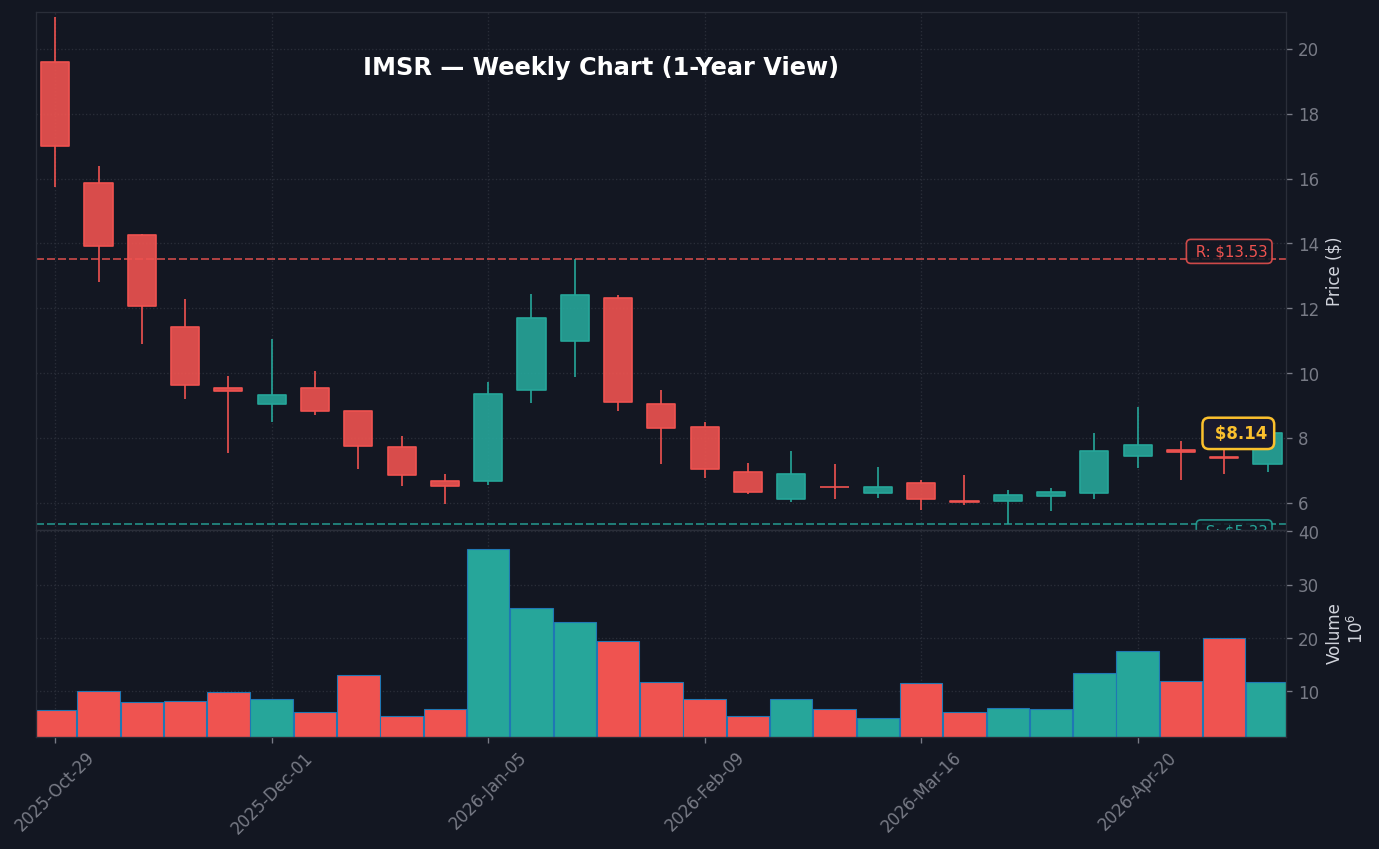
The weekly view highlights that IMSR remains well off its 52-week high of $31.50, but it has successfully moved past the 20-day support level of $6.70. This recent price action is encouraging for bulls looking to reclaim the $8.94 resistance level seen in the 20-day high analysis.

IMSR Weekly Chart — 1-year view with SMA50/200

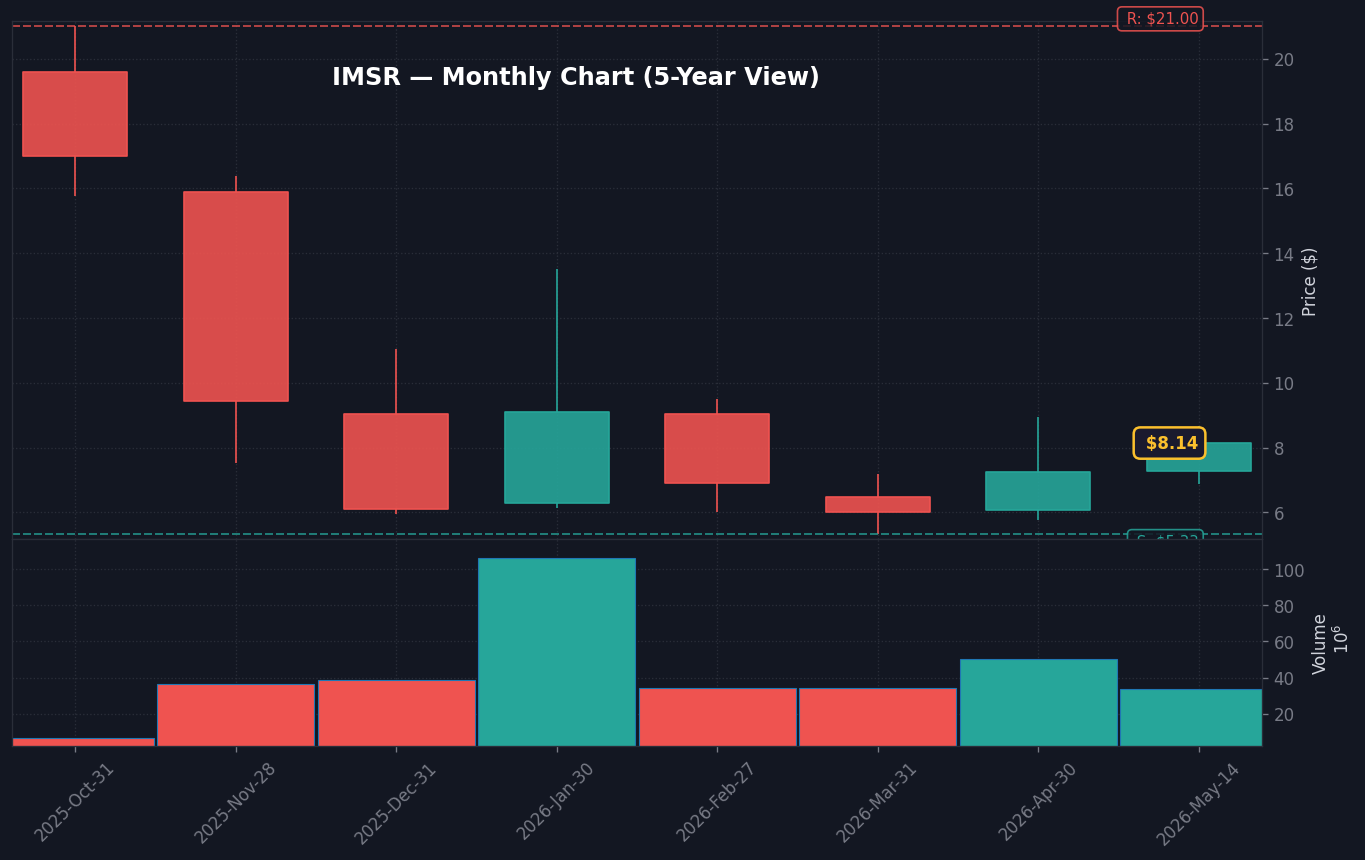
On a monthly timeframe, the 3.14 beta indicates the high volatility investors are exposing themselves to. History is a cautionary note here: when checking previous analogs, on 2026-01-13 (similar RSI/Vol setup), the stock fell 31.2% over the subsequent 20 days. Investors must weigh the current execution momentum against these historical reversion patterns.

IMSR Monthly Chart — 5-year view with SMA50/200
Takeaway: Key resistance stands at $8.94; failure to hold $6.70 would weaken the current bullish technical setup.

Outlook and Watchpoints

Sustaining the move requires actual contract wins or regulatory approvals, not just the stated execution pivot. Confirmation would be sustained volume above 2M shares, suggesting institutions hold rather than quick profit-taking.

Invalidation: breakdown below $6.88 (50-day SMA) on thinning volume. If the news cycle slows, mean reversion could dominate, pulling the stock lower.

I’d be cautious. The stock trades on narrative, not earnings. Speculative utilities face funding risks if 10-year yields spike. Watch $7.00; below that, $6.70 is critical support.

Frequently Asked Questions

Why did IMSR stock surge today?

IMSR stock rose 14.47% following the release of Q1 earnings call highlights, which signaled a shift to execution mode for the company’s nuclear technology. This move was supported by 2.71x relative volume, indicating strong market interest in the company’s progress.

Is Terrestrial Energy (IMSR) profitable?

No, Terrestrial Energy is a pre-revenue development company. Its trailing EPS is -0.39 and it currently has no TTM revenue, reflecting its status as an early-stage nuclear technology developer.

Data sources: Yahoo Finance · SEC EDGAR · MarketBeat · Insider Monkey · GuruFocus.com · Simply Wall St.


This market commentary is for informational use only. The views expressed are those of the author and do not constitute financial, investment, or trading advice.

📊 Data Sources
yfinance · FRED (St. Louis Fed) · SEC EDGAR · Finnhub · World Bank · Wikidata
Last Updated: 2026-05-15 05:15 KST
This analysis uses public data sources. Investment decisions are your own responsibility.
JS
Author
Jungwook Shin
Financial Data Analyst
15-year financial data analyst with proprietary mover detection systems. Real-time catalyst analysis across US, Korea, and Japan markets.

프로필 보기 →

Technical Snapshot — IMSR
RSI (14)52.7
MACD Histogram-0.0067
Bollinger Upper$8.41
Bollinger Lower$6.65
BB PositionInside
SMA 50$6.88 (above)
Scenario Analysis — IMSRNeutral (2 each)
BULL — Target
$8.41
Price above SMA50 ($6.88)
Strong momentum gap +14.5%
BASE — Target
$6.88
Consolidation around SMA50
BEAR — Target
$6.65
RSI 53 — below midpoint
MACD hist -0.0067 — negative momentum

Leave a Comment

Your email address will not be published. Required fields are marked *

Scroll to Top
𝕏 ƒ in 🔗