🇺🇸 US Market CLOSED Thu, May 14 &0514am3705; 5:07 AM EDT
Data: SEC · EDGAR · FRED · Yahoo Finance

Why VLN Stock Is Up: Earnings Results Or Guidance — Key Levels

VLN technical chart with RSI, MACD, Bollinger Bands
VLN daily chart with SMA 20/50/200 and volume — source: Finviz, May 14, 2026 · Chart: Finviz

Updated: May 13, 2026 at 04:15 PM ET · Reading time: 4 min · Author expertise: Small-Cap Equity Analyst

Why trust us: We separate factual market inputs from interpretation and link our process below.

Methodology · Data sources · Editorial policy

VLNValens Semiconductor Ltd.
$2.94▲ +9.07%

Technology · Semiconductors

Volume5.4M
Avg Volume1.8M
Market Cap$310M
Catalystearnings results or guidance

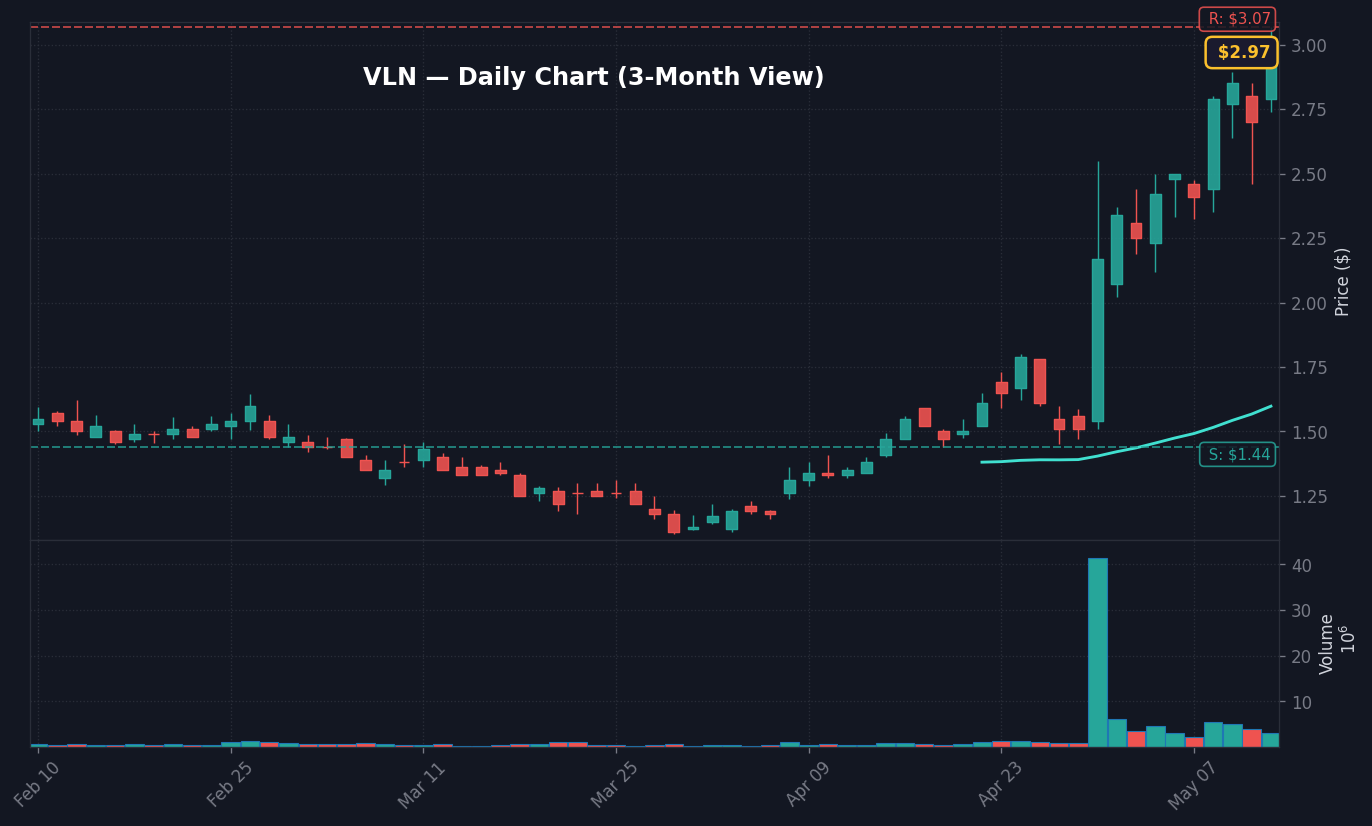
Heads up — Valens Semiconductor Ltd. (VLN) just popped 9.1% following a Q1 2026 report that topped revenue estimates, and here is the read on the setup.

Valens Semiconductor shares moved 9.1% higher today on 2.95x relative volume, reflecting a clear investor response to the Q1 earnings call. The primary driver is the company’s ability to exceed revenue expectations, as reported in the latest Valens Semiconductor Ltd. Q1 2026 Earnings Call Summary. Given the stock’s high beta of 3.01, this move represents significant alpha of approximately 7.36% compared to the S&P 500’s 0.57% gain, suggesting that the market is viewing these results as a distinct, idiosyncratic positive for the semiconductor sector. Our conviction in this specific catalyst is partial, as the company’s revenue remains light despite the top-line beat.

While tech peers represented by the XLK ETF climbed 0.96%, VLN’s performance indicates that participants are hunting for value within smaller-cap, high-growth connectivity plays. It is worth noting that while the earnings release is a positive signal, the structural profitability of the company remains a headwind, given the negative operating margins.

What This Company Does

Valens Semiconductor Ltd. is an Israel-based fabless semiconductor firm, specializing in connectivity solutions for the audio-video and automotive industries. Per Wikipedia, the company is recognized for inventing the HDBaseT standard, which facilitates the transmission of high-bandwidth signals—including ultra-high-definition video and power—over long-reach cables. With a market capitalization of $310.09M, the firm maintains a lean operation with 233 employees, focusing on complex connectivity standards like MIPI A-PHY.

The company operates primarily through two segments: Cross-Industry and Automotive. In the latter, Valens provides critical chipsets that support advanced driver-assistance systems (ADAS) and autonomous vehicle architectures. By providing plug-and-play convergence for industrial and automotive sectors, the company positions itself as a technical enabler for modern digital signage and in-vehicle networking. Their business model relies on direct sales and third-party distribution to penetrate niche, high-performance tech verticals.

Takeaway: Valens provides specialized connectivity chips for high-growth automotive and AV connectivity markets.

Why It Moved Today

The 9.1% price jump is tied directly to the Q1 2026 results. According to coverage from Zacks, the company reported a loss while simultaneously topping revenue estimates. This divergence between bottom-line disappointment and top-line strength has at times creates high volatility, which explains the 2.95x surge in trading volume. Today’s movement is a classic example of traders repositioning after a binary event; the market is essentially pricing in potential recovery against the background of a 4.3% unemployment rate as of April 2026 per FRED data.

It is worth flagging that short interest in VLN is negligible at 0.02% of the float, meaning this rally is likely driven by genuine fundamental buying or momentum reallocation rather than a forced squeeze. Our read is that the market is focused on the revenue beat as a sign of demand stability. However, with the Fed Funds Rate at 3.64% per 2026-04-01 data, the cost of capital remains a persistent burden for a company with negative free cash flow of $4.00M.

MetricValue
Trailing EPS-0.31
Forward EPS-0.11
Revenue (TTM)$70.62M
Revenue Growth16.40%
Gross Margin62.42%
Trailing P/EN/A
Valens Semiconductor Ltd. Q1 2026 Earnings Call Summary
Source: Moby

Takeaway: The revenue beat is the primary driver, but overall profitability concerns limit our conviction level here.

Chart Setup and Key Levels

Daily Chart

VLN’s daily chart shows the stock is currently pushing against an overbought RSI of 75.75, which flags potential near-term exhaustion. With the price comfortably above the 50-day SMA of $1.60, the trend is constructive, but the proximity to the 20-day high resistance of $3.07 is a critical pivot. Note that the 5-day momentum is quite stretched at +17.8%.

VLN Daily Chart — 3-month view with SMA50/200

Weekly Chart

Weekly context reveals the stock is trading within its 52-week range of $1.10 to $3.34. The current price structure is testing the middle of this range, and buyers have effectively defended the $1.44 support level multiple times. To maintain the current bullish narrative, the stock needs to clear the $3.07 resistance cleanly on sustained high volume.

VLN Weekly Chart — 1-year view with SMA50/200

Monthly Chart

Monthly indicators are largely consistent with the weekly setup, showing a recovery trend from the $1.10 support. History suggests caution; the last 14 analog matches where the stock displayed an RSI above 70 on high volume resulted in a median 20-day return of -14.66%. This indicates that mean reversion often follows these impulsive, news-driven bursts.

VLN Monthly Chart — 5-year view with SMA50/200
Takeaway: Key resistance sits at $3.07; failing to break this level likely triggers a retracement to support.

Outlook and Watchpoints

The outlook remains dependent on whether this earnings-driven momentum can bridge the gap toward the $4.00 consensus price target. What would confirm this setup is a breach of the $3.07 resistance level with follow-through volume, signaling institutional accumulation above the current range. I’d lean cautious until this confirmation, as the historical data for similar technical setups leans negative for the 20-day window.

Conversely, what would invalidate this setup is a breakdown below the $1.44 support level. A return below this mark would signal that the revenue beat failed to alleviate concerns regarding the company’s structural loss-making status. I’m monitoring the $2.23 VWAP as a key intraday anchor; trading consistently above this confirms the current buyer bias.

Frequently Asked Questions

Why is VLN stock up today?

VLN stock moved 9.1% higher today primarily due to a positive reaction to its Q1 2026 earnings results. While the company reported a loss, it beat revenue estimates, which triggered a surge in volume (2.95x relative volume) as investors re-evaluated the company’s demand profile.

What is the key resistance level for VLN?

The key resistance level for VLN is $3.07, which represents its 20-day and 60-day high. A clean break above this level is required to validate the current bullish setup.

Data sources: Yahoo Finance · SEC EDGAR · Moby · Simply Wall St. · Zacks · Motley Fool


Nothing in this article should be construed as a recommendation to buy or sell any security. Past performance does not guarantee future results.

📊 Data Sources
yfinance · FRED (St. Louis Fed) · SEC EDGAR · Finnhub · World Bank · Wikidata
Last Updated: 2026-05-14 05:15 KST
This analysis uses public data sources. Investment decisions are your own responsibility.
JS
Author
Jungwook Shin
Financial Data Analyst
15-year financial data analyst with proprietary mover detection systems. Real-time catalyst analysis across US, Korea, and Japan markets.

프로필 보기 →

Technical Snapshot — VLN
RSI (14)75.8 (Overbought)
MACD Histogram+0.0912
Bollinger Upper$3.12
Bollinger Lower$0.99
BB PositionInside
SMA 50$1.60 (above)
Scenario Analysis — VLNBullish Lean (3 vs 1)
BULL — Target
$3.12
MACD hist +0.0912 — positive momentum
Price above SMA50 ($1.60)
Strong momentum gap +9.1%
BASE — Target
$1.60
Consolidation around SMA50
BEAR — Target
$0.99
RSI 76 — overbought, profit-taking risk

Leave a Comment

Your email address will not be published. Required fields are marked *

Scroll to Top
𝕏 ƒ in 🔗