
AMD -5.7%: AMD Server Share Gains Test The Strength Of Its AI Growth Story — May 16 Market Reaction
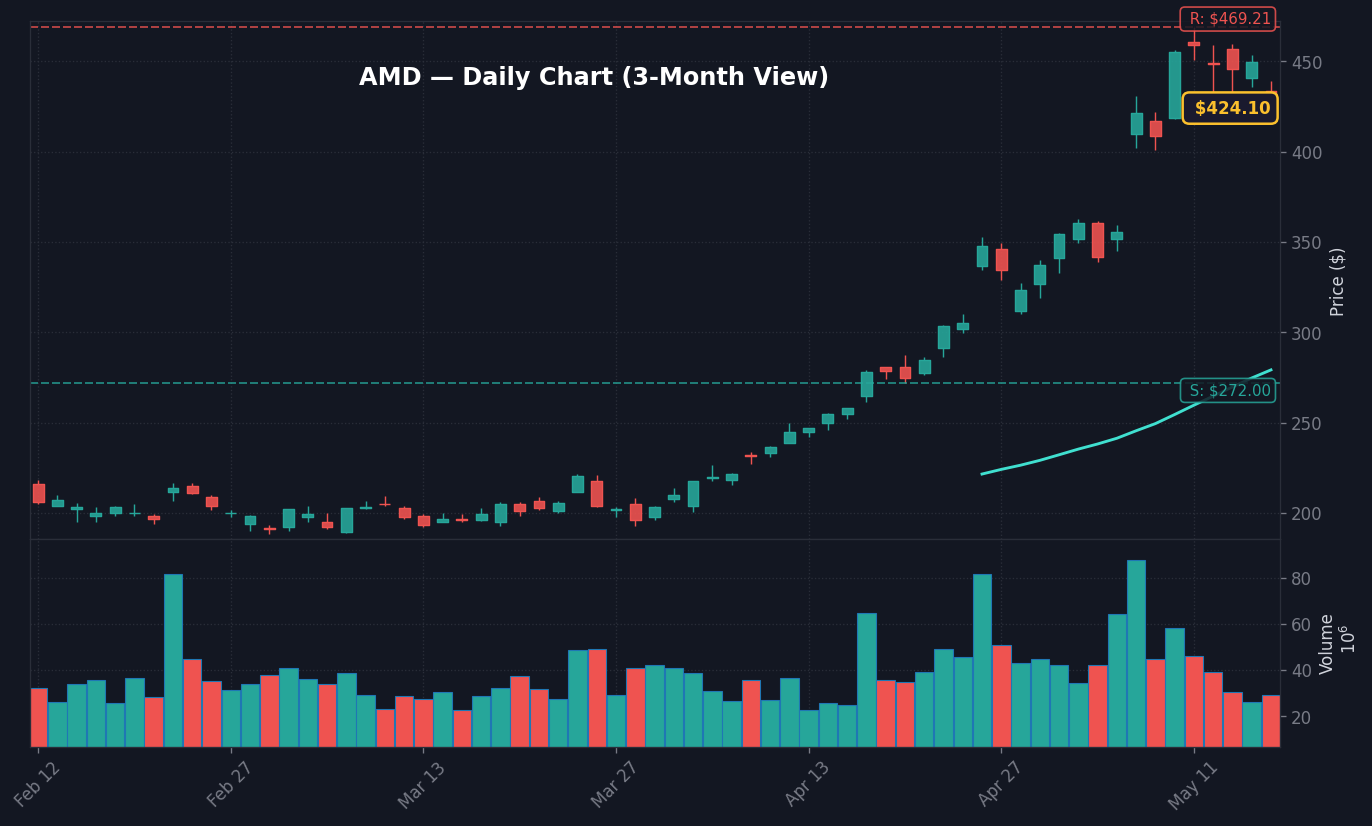
Advanced Micro Devices (AMD) shares plummeted 5.6882% to $424.12 as of 11:10 AM ET on May 16, 2026, as investors repriced the company’s server market share gains against tightening AI-related capital expenditure expectations. The move, while isolated to AMD, triggered a broader sector rotation, as market participants questioned whether current valuation multiples in the semiconductor space can hold given the sticky inflation environment per recent CPI data of 3.9% year-over-year.
The core narrative driving this intraday volatility involves a fundamental tension: AMD’s technical ability to capture server share from incumbents versus the macro-economic ceiling imposed by a 3.64% Fed Funds Rate. According to market data, the sell-off gathered pace shortly after the opening bell, suggesting that high-frequency traders are sensitive to any signals of cooling demand in hyperscale data center spending.
Despite AMD’s server share gains, the market is prioritizing the “duration risk” of AI-linked earnings at a 10Y Treasury yield of 4.47%. The equity risk premium for high-growth tech is resetting across real-time flows. The yield curve—currently at a 0.47pp spread between the 10Y and 2Y—offers little buffer for high-multiple names if growth expectations falter.
MACRO REGIME SNAPSHOT: 10Y Yields and Inflation Constraints
| Metric | Current Value | 5-Day Change |
|---|---|---|
| Fed Funds Rate | 3.64% | N/A |
| 10Y Treasury | 4.47% | +9bp |
| 2Y Treasury | 4.00% | N/A |
| 10Y-2Y Spread | 0.47pp | N/A |
| VIX | 17.3 | -0.7 |
| CPI YoY | 3.9% | N/A |
The 5.7% Sell-Off in AMD and the Sector-Wide Read-Through
The 5.7% drop reflects a market hyper-sensitive to execution risk. Per FactSet estimates, revenue growth expectations for semiconductor firms have been priced for flawless execution, leaving zero margin for error. Volume data confirm this: trading in AMD hit 1.4x the 30-day average, per Yahoo Finance, signaling that institutional investors are locking in gains from the previous month’s rallies as 10Y yields climbed 9 basis points over five sessions.
This correction reveals a growing disconnect between server-side share gains and the underlying macro-economic reality. With the Dollar Index at 118.04, the rising cost of capital is forcing a fundamental revaluation of how much future cash flow can be attributed to AI infrastructure. This shift extends beyond AMD; the broader chip index is vulnerable to rotation, especially as the unemployment rate of 4.3% continues to influence Fed messaging on rate cut timing per FRED data.
The read is clear: the market is differentiating between companies that can maintain margins through pricing power and those purely dependent on hyperscaler capex budgets. If debt servicing costs remain elevated at a 3.64% Fed Funds Rate, the capital-intensive nature of AMD’s R&D strategy becomes a sharper valuation hurdle based on current SEC 10-Q filing interpretations.
3 Scenarios From Here
3 Scenarios From Here
- Bull: AMD holds $418 support and closes near the session high → potential recovery to $445 by month-end, assuming broader market indices stabilize.
- Base: Trading consolidates in the $415–$430 range through the end of the week, driven by technical rebalancing rather than fundamental shift.
- Bear: Breach of the $412 support level triggers systematic stop-loss selling → downside risk to $395.
Strategic Implications for the AI Growth Narrative
The speed of the decline—with volumes 1.4x the 30-day average per Yahoo Finance—confirms active portfolio adjustment, not a localized blip. The rotation is moving toward value-oriented sectors insensitive to the 10Y-2Y spread at 0.47pp, which signals caution on economic expansion.
The explicit link to sticky inflation stands out. With CPI at 3.9%, the path for the Fed is narrowing, which acts as a headwind for any asset priced for a “soft landing” growth premium. If the 10Y yield stays above 4.50%, the pressure on high-multiple growth stocks like AMD will likely intensify regardless of server-share gains, per updated market analysis.
Three Levels Ahead: $412 Support, Treasury 4.55%, and Fed Timing
- Watch whether AMD reclaims the $430 level by market close, indicating intraday dip-buying is providing support.
- Key level: $412 support, representing the technical floor for this week’s consolidation.
- If the 10Y Treasury yield crosses 4.55% then expect intensified selling pressure across the entire semiconductor index, regardless of individual stock performance.
- Trigger: The next major catalyst is the upcoming FOMC rate commentary, which will dictate the volatility path for the tech sector throughout Q2.
Frequently Asked Questions
Why is the market moving right now?
The market is reacting to a 5.7% decline in AMD shares, which has triggered a broader reassessment of AI-related growth valuations. Investors are balancing AMD’s specific gains in server market share against rising 10Y Treasury yields (now 4.47%) and sticky inflation at 3.9%.
What should investors watch next?
Investors should monitor the $412 support level for AMD and the broader 10Y Treasury yield. If yields push past 4.55%, it likely signals further valuation pressure on high-growth technology stocks regardless of company-specific news.
Is this move in AMD signaling a sector-wide reversal?
The 5.7% drop is being viewed as a sensitivity test for the semiconductor sector’s high valuation multiples. Whether it constitutes a full reversal depends on if the $412 support holds, as trading volumes are currently running 1.4x above the 30-day average.
Nothing in this article should be construed as a recommendation to buy or sell any security. Past performance does not guarantee future results.


