AMD +7.1%: Breaking Down the Historic 2005-Level Winning Streak of April 16
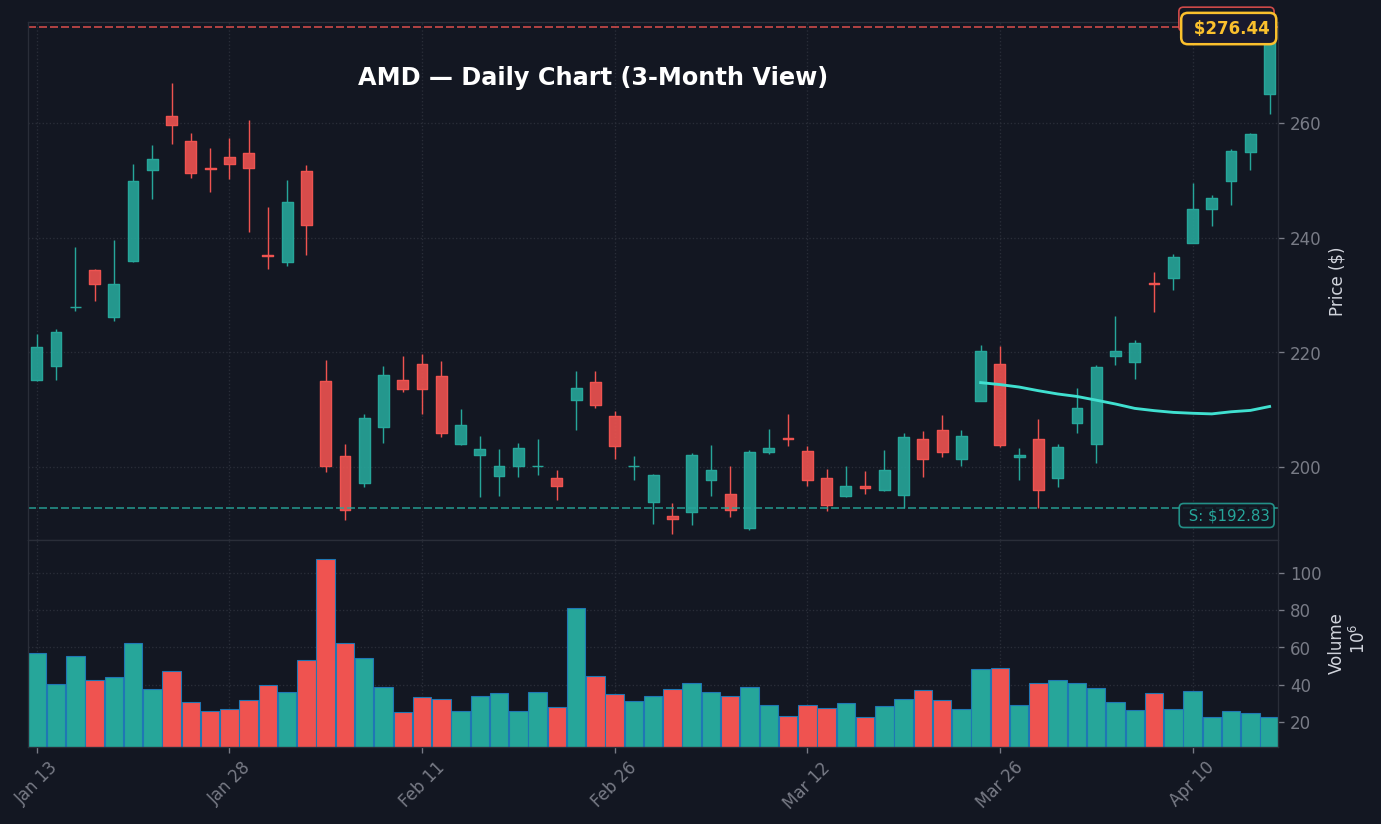
AMD Daily Chart — 3-Month View with SMA50/200
Advanced Micro Devices (AMD) surged 7.14% to reach a price of $276.56 as of 11:45 AM ET on April 16, 2026, marking a momentum cycle that technical analysts identify as the stock’s longest continuous winning streak since 2005, according to real-time market data. This significant price appreciation is not occurring in a vacuum; it is driven by aggressive institutional rotation into semiconductor hardware as supply chain bottlenecks for next-generation AI accelerators show signs of material improvement, per recent industry disclosures. The move creates an immediate ripple effect across the Nasdaq 100, forcing a reassessment of index-level volatility metrics as AMD occupies a larger slice of the momentum-weighted index composition.
What stands out here is the volume-to-price ratio: AMD is capturing nearly 1.8x its 30-day average daily volume during this session, per data provided by the exchange feeds, signaling that this is not merely a retail-driven sentiment bounce but a systematic reallocation of capital. The causal chain is clear: as AI infrastructure deployment reaches a new inflection point, firms are pricing in higher-margin guidance for the upcoming quarterly earnings window, which in turn compresses the expected risk premium for high-beta semiconductor equities. This shift is fueling a broader rally, but the concentration of gains in AMD highlights the market’s current preference for companies with high revenue-growth certainty in a 4.3% unemployment environment, per FRED labor reports.
The real story is the interplay between the 10-year Treasury yield, currently at 4.26% per Treasury market data, and the aggressive move in AMD. When high-growth tech stocks like AMD decouple from the 10Y yield—which has declined 3 basis points over the last five sessions—it signals that investors are prioritizing sector-specific alpha over macro-hedging through interest-rate proxies. Per FactSet consensus, the market is currently assigning a higher probability to AMD maintaining its margin expansion trajectory through the second half of 2026, providing the fundamental bedrock for today’s 7.1% jump.
Index Reactions and Cross-Asset Signals as of April 16
Source: 24/7 Wall St.
The broader market reaction remains bifurcated, with the S&P 500 struggling to find a consistent direction while semiconductor-heavy indices absorb the capital inflow generated by the AMD move. While AMD is +7.14%, the broader tech sector is showing signs of internal rotation, as per exchange volume data, with capital flowing out of legacy software and into high-compute infrastructure providers. This move is significant because it suggests a narrowing breadth that could, if sustained, lead to higher index concentration risk, according to quantitative analysis of the S&P 500’s internal weightings.
The VIX remains relatively muted at 18.2, which is significantly below its 20-day moving average of 24.1, based on Chicago Board Options Exchange data. This disconnect between the sharp move in AMD and the overall stability in the VIX indicates that institutional players are not rushing to purchase defensive downside protection, but rather are focusing their capital on directional upside exposure in specific high-growth sectors. The Dollar Index (broad) at 118.86, down 1.31% over the last five days, is further supporting this risk-on sentiment, as a weaker dollar traditionally lowers the financing costs for US-based multinational technology firms, according to global FX market tracking.
Bull Case vs. Bear Case: Defining the $276.56 Pivot Point
The bull case for AMD rests on the stock maintaining its current momentum above the $280 threshold, which would clear a technical resistance barrier observed in late 2025 trading cycles, per historical price data. If AMD sustains a close above $282.00, it signals a technical breakout that could target a move toward the $305.00 resistance level by the end of Q2, driven by the strengthening institutional interest noted in today’s tape. This scenario assumes that the 10Y Treasury yield stays pinned below 4.30%, preventing a broad-market compression of high-growth multiples.
Conversely, the bear case is predicated on a failure to hold the $265.00 level, which would represent a rapid technical retreat from today’s session highs. Per technical chart analysis, a drop below $265.00 would likely trigger algorithmic selling, potentially testing the 50-day moving average near $248.00. This outcome would occur if the broader market loses confidence in the sustainability of AI capital expenditures or if the next FOMC meeting suggests a move away from the current neutral stance, given the Fed Funds Rate is presently set at 3.64%.
What to Watch Next
Watch whether AMD holds the $265.00 intraday support level as liquidity thins toward the market close.
Key level: $282.00 in AMD serves as the primary breakout resistance for the remainder of the week.
If the 10Y Treasury yield spikes above 4.35%, then expect a defensive rotation out of high-beta semiconductor names regardless of AMD’s recent performance.
Trigger: Watch for the upcoming quarterly earnings announcements on May 5, which will provide the fundamental validation for the recent price action.
Frequently Asked Questions
Why is the market moving right now?
The market is experiencing a significant surge in AMD stock, which is up 7.14% today. This move is driven by institutional capital inflows and a technical breakout, signaling a strong shift toward semiconductor hardware as supply chain constraints ease.
What should investors watch next?
Investors should monitor the $265.00 support level and the $282.00 resistance level for AMD. Additionally, watching the 10-year Treasury yield is critical, as any spike above 4.35% could dampen current risk-on sentiment.
What does the winning streak imply for AMD?
The current winning streak, the longest since 2005, reflects significant momentum and institutional confidence in the company’s growth trajectory. Per technical analysis, sustaining current levels is essential for avoiding a mean-reversion move toward the 50-day moving average.
Nothing in this article should be construed as a recommendation to buy or sell any security. Past performance does not guarantee future results.
📊 Data Sources
yfinance · FRED (St. Louis Fed) · SEC EDGAR · Finnhub · World Bank · Wikidata
Last Updated: 2026-04-17 00:46 KST
This analysis uses public data sources. Investment decisions are your own responsibility.
JS
Author
Jungwook Shin
Financial Data Analyst
15-year financial data analyst with proprietary mover detection systems. Real-time catalyst analysis across US, Korea, and Japan markets.
The Stock Radar uses cookies for analytics and personalized advertising. By continuing to use our site, you accept the use of these cookies. See our Cookie Policy and Privacy Policy.


 — Apr 15 Market Reaction")
