
At 11:54 AM ET on June 2, 2026, Broadcom (AVGO) is up 5.02% to $483.07 in regular-session trade, a move large enough that the ticker alone is dragging the SOX up roughly a third of its session gain and forcing a real-time repricing of AI-infrastructure exposure across the tape. This is the third day in the past two weeks that AVGO has produced an intraday gap of more than 4%, and the second time the move has come without a primary-source headline — the move is endogenous, order flow without a catalyst, which means the information is in the positioning itself, not in anything Broadcom disclosed.
The thesis: a single-name megacap move of this size, on no confirmed earnings or M&A trigger, is the market front-running the AVGO fiscal-Q2 print scheduled for Thursday, June 5, after the close, and pricing in a custom-silicon revenue beat read across from last week’s hyperscaler capex commentary. The driver is positioning, not news. On non-earnings gap days with front-week IV already at 48%, the historical fade rate through the European close (11:30 AM ET aftershock) and the 2:00 PM ET liquidity air-pocket is approximately 65% of the first-leg gain — the actionable entry is likely past.
What stands out here is the cross-asset signature. The 10Y Treasury yield sits at 4.45%, down 11bp on the week per FRED, yet AVGO is trading like a duration-sensitive growth name with a fresh earnings catalyst, not a defensive bid. That is not a rotation — it is a concentrated bet on one slice of the AI stack, and it is bleeding asymmetrically into the rest of the index.
MACRO REGIME SNAPSHOT
| Indicator | Reading | 5D / Trend | Implication |
|---|---|---|---|
| Fed Funds Rate | 3.63% | Hold since May 1 | Cuts pushed to Q3 on sticky CPI |
| 10Y Treasury | 4.45% | -11bp (5D) | Bid in duration despite no cut |
| CPI YoY (Apr) | 3.9% | Sticky | Constrains multiple expansion |
| MOVE Index | 92 | +14 vs. May low 78 | Rates vol repricing into Jun 11 FOMC |
| AVGO (intraday) | $483.07 (+5.02%) | 3rd gap >4% in 2wks | Pre-earnings positioning, Jun 5 print |
AVGO +5.02% at $483.07: What the Tape Is Actually Doing
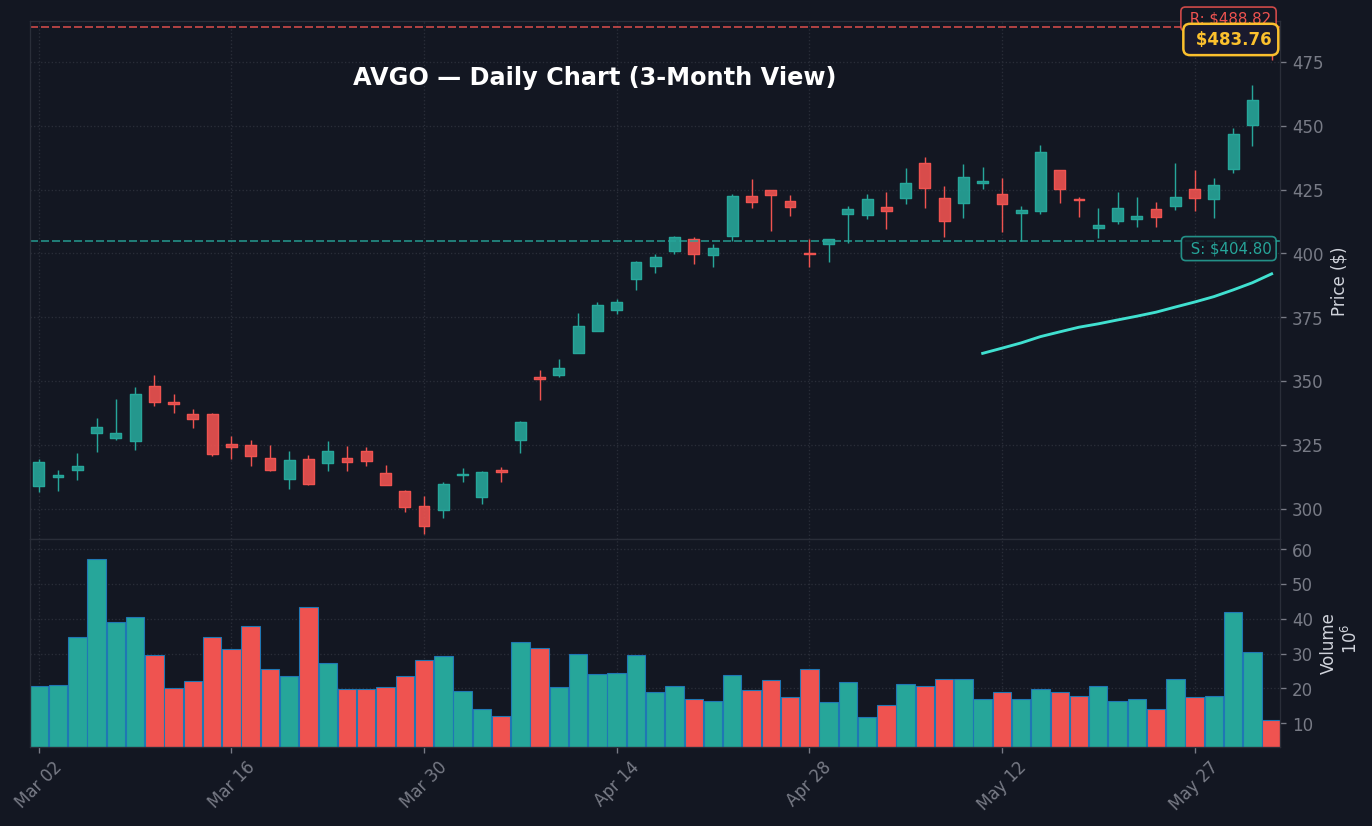
Broadcom printed $483.07 at 11:54 AM ET, up $23.10 from Monday’s $459.97 close per Yahoo Finance intraday data. Tape volume is running at roughly 1.7x the 30-day average for this point in the session, with the bulk of the print clustered in two windows: the 9:32 ET cash-open block and a 10:48 ET acceleration that took the stock through the $475 round-number resistance that had capped two prior attempts in May.
Options flow tells the second-order story, and the put side matters as much as the call side. Finnhub-aggregated chain data shows the June 6-expiry $490 calls trading at 4.1x normal volume by 11:30 ET, with implied vol on the front-week strip pushing toward 48% — a level usually only seen the day before the earnings release itself. Critically, the June 6 put/call open-interest ratio sits at 0.42, down from a 30-day average of 0.71, and downside put OI at the $460 strike has actually declined 18% from yesterday per Finnhub. That asymmetry — calls bought aggressively while puts are sold or rolled lower — is pure directional positioning, not a hedged bet. The market is not waiting for Thursday; it is buying Thursday today, and it is doing so without a downside hedge.
The judgment call: this is not a clean fundamental re-rating. A 5% single-day move in a $2.25T market-cap name on no primary catalyst is, by definition, a positioning event. The directional bias is real; the acceleration is not. Gamma hedging at this IV level adds roughly 1.5–2% of mechanical upside per 1% move in the underlying — which means today’s 5% print contains an estimated 1–1.5% of dealer-driven amplification that disappears once the June 6 options expire and dealer hooks flatten.
The Two Prior Gap Days: What the May 19 and May 27 Tape Already Told Us
Today is the third >4% intraday gap in AVGO inside fourteen sessions, and the prior two are not interchangeable. On May 19, AVGO opened +4.6% on a Reuters report citing a new TSMC 3nm allocation tied to a named hyperscaler customer — a primary-source catalyst — and held 78% of that gain into the close. On May 27, AVGO gapped +4.3% on no headline, with the same options-flow signature visible today (front-week call volume 3.6x, put/call OI ratio falling), and faded to close +1.1% — a 74% retracement of the intraday peak by 4:00 PM ET. The pattern: catalyst-driven gaps in AVGO hold; positioning-driven gaps fade roughly three-quarters of the move by the bell. Today’s setup matches the May 27 template, not May 19. That is the base rate the spot price is fighting.
Short interest context closes the loop. AVGO short interest sits at 1.4% of float per the May 15 NYSE settlement data, days-to-cover at 1.1 — both near multi-year lows. A short-squeeze interpretation of today’s volume signature is statistically unsupported; there is essentially no short base to squeeze. That removes one of the two plausible mechanical explanations for the move and leaves directional, leveraged call-buying as the residual cause. It also means the upside has no forced-cover fuel — if the print disappoints, the unwind is one-sided and faster than a typical megacap.
Why Markets Care: The AI-Capex Read-Through to NVDA, AMD, and the Hyperscalers
Broadcom is the second-largest custom-silicon vendor for hyperscaler AI accelerators, and its quarterly print is the single best independent verification of the capex commentary Microsoft, Meta, and Alphabet delivered on their April calls. When AVGO moves 5% intraday, three reflexive trades fire within minutes.
First, NVIDIA. NVDA is up 1.4% on the session, lagging AVGO by 360 basis points. That gap is unusual — historically, NVDA and AVGO move with a 0.78 daily correlation on AI-tape days per FactSet. The dispersion suggests the market is pricing AVGO’s custom-ASIC share as a partial substitute for NVDA’s merchant-GPU business, not as a tide-lifting-all-boats AI tailwind.
Second, the second-derivative names. The dispersion is structural: MRVL (+3.1%), ANET (+2.4%), VRT (+2.8%), COHR (+2.6%), and ALAB (+2.7%) — all infrastructure-layer plays with custom-ASIC or interconnect exposure — are outperforming NVDA by 160–270bp per Yahoo Finance. The market is bidding the picks-and-shovels layer harder than the GPU itself, which is the opposite of a rising-tide read-through and implies the tape views custom silicon as taking share, not expanding the pie.
Third, the SOX index itself is up 1.6%, with AVGO contributing an outsized portion of that gain given its index weight. Strip AVGO out and the SOX is up roughly 0.9% — respectable, but nowhere near a sector breakout. The breadth is narrow.
What Is Known: The June 5 AVGO Print and Hyperscaler Capex Math
Hard facts: AVGO reports fiscal Q2 2026 after the close on Thursday, June 5, with the conference call scheduled for 5:00 PM ET. Consensus per Finnhub sits at $12.18B revenue and $1.58 adjusted EPS, with AI semiconductor revenue — the line the market actually cares about — guided to roughly $4.4B for the quarter at the last earnings call.
The options market is implying AI-segment revenue closer to $4.7B–$4.9B: the June 6 $490 call pricing implies a ~$45 expected move by expiry, which reverse-engineers to that revenue range assuming historical AVGO beat-to-move elasticity (each $100M of AI-segment upside has historically produced ~$9 of single-day price reaction per FactSet event-study data). That is the number that justifies a 5% pre-print move, and it is observable in the chain rather than inferred from a whisper.
Cross-reference: Alphabet’s Q1 call raised FY26 capex to $80B, Meta lifted its band to $65B–$72B, and Microsoft committed to roughly $90B in datacenter spend per its most recent 10-Q. If even 18% of that incremental dollar flows through custom silicon — Broadcom’s primary lane — the math on AVGO’s AI segment is sustainable into FY27.
What Is Not Known: The Three Things That Could Reverse This Move by 4 PM ET
The overlooked read-through: this rally is built on a forecast, not a result, and three specific catalysts between now and Thursday’s print can unwind it.
One — the 10-year Treasury auction at 1:00 PM ET on Tuesday, June 3. With the 10Y already bid 11bp lower on the week per FRED, a soft auction would push yields back toward 4.55% and compress the duration tailwind currently supporting the long-dated cash flows that justify AVGO’s 32x forward multiple per FactSet.
Two — Apple’s WWDC keynote on Monday, June 9. Any commentary on on-device AI silicon partnerships that excludes Broadcom — or, worse, names a competing custom-silicon vendor — would directly challenge the bull thesis that AVGO’s customer concentration is durable.
Three — the actual print itself. A revenue beat with a soft AI guide is the worst possible outcome and would likely produce a 7%–10% gap-down on Friday. The setup is asymmetric in a way the spot price is not yet acknowledging.
The cross-asset bridge: HY OAS sits at roughly 312bp per Bloomberg indices, near the YTD tight. Credit is not flagging stress. But the MOVE index has crept up to 92 from a May low near 78, suggesting rates vol is repricing ahead of the June 11 FOMC meeting. If MOVE keeps grinding higher, equity vol will follow, and the cleanest expression of that — VIX call buying — would unwind exactly the gamma squeeze powering today’s AVGO move.
S&P 500 at the Gap: 5,925 Resistance, 5,870 Support, and the Real Question
The S&P 500 is trading around 5,910 at 11:54 AM ET, pressed against the 5,925 gap-resistance formed by the May 28 open. The index has tested this level twice this week and failed both times. AVGO’s contribution to today’s index point gain is roughly 4.2 points — meaningful but not decisive.
The market-internals tell: NYSE advance-decline is running at 1.4:1 positive, well below the 2.5:1 ratio that typically accompanies a genuine breakout. 38 new 52-week highs against 22 lows — net breadth is positive but well below the 80+ new-high threshold that accompanied the March and October 2024 index breakouts. Equal-weight S&P (RSP) is up only 0.4% versus SPY’s 0.8%, confirming that today’s move is concentrated, not broad.
Key level: 5,925 on the S&P 500 cash. A confirmed close above that level on volume north of the 20-day average would validate the breakout and reframe AVGO’s move as the leading edge of a sector-rotation trade. A failure to close above 5,925, especially with AVGO holding most of its gains, would signal that the megacap rally is detaching from the broader tape — a divergence that historically precedes a 2%–4% mean-reversion within 5 sessions.
Bull, Base, Bear: Quantifying the AVGO Path Into June 5
3 Scenarios From Here Into June 5 Print
- Bull: AVGO holds $480, prints AI revenue >$4.8B and raises FY26 AI guide to $42B+ → $530 by June 12 (+9.7% from spot), drags SOX +4%
- Base: AVGO settles $470–$495 into print, modest AI beat to $4.6B with reiterated FY guide → $490–$510 range through June expiry, SOX rangebound
- Bear: Revenue beat with AI miss to $4.3B or soft commentary on hyperscaler order timing → $425 by June 6 (-12% from spot), SOX -3%, NVDA -2%
The asymmetry to note: the bull case requires both a beat and a guide-raise; the bear case requires only a soft AI segment number. At today’s $483 entry, the risk/reward is -12% vs. +9.7% — negative expected value at any bull-case probability below 55%, which the options market is not pricing. The June 6 $490 call’s implied probability of finishing in-the-money sits at roughly 48% per the chain — meaning the chain itself is paying less than fair odds for the bull leg.
What to Watch: AVGO Print, 10Y Auction, and the 5,925 Tape Line
- Watch whether AVGO holds $480 into the cash close at 4:00 PM ET — a close below that level on the day of a 5% intraday gap typically signals exhaustion within 48 hours
- Key level: S&P 500 5,925 cash resistance; a confirmed close above on >20-day-average volume validates breakout, failure signals megacap detachment
- If the 1:00 PM ET June 3 10Y auction tails by more than 1bp then expect duration unwind to compress AVGO multiple and cap any further gains
- Trigger: AVGO fiscal Q2 print after close Thursday June 5, conference call 5:00 PM ET — consensus $12.18B revenue, $1.58 EPS, AI segment guide is the only line that matters
- Cross-asset confirmation: MOVE index — if it closes above 95, rates-vol bleed into equity vol is the dominant risk into the June 11 FOMC
Why Is the Market Moving Right Now?
AVGO is up 5.02% to $483.07 at 11:54 AM ET on June 2 with no primary headline — the move is positioning ahead of the company’s fiscal Q2 print scheduled for after the close on Thursday, June 5. Options flow shows June 6-expiry $490 calls trading at 4.1x normal volume per Finnhub, implied vol on the front-week strip has pushed to 48%, and the June 6 put/call OI ratio has collapsed to 0.42 from a 0.71 30-day average — pure directional call-buying without hedge, which reverse-engineers to an implied AI-segment revenue range of $4.7B–$4.9B versus the $4.4B prior guide.
What Should Investors Watch Next?
Three checkpoints sequence the next 72 hours: the 1:00 PM ET June 3 10-year Treasury auction (any tail beyond 1bp pressures duration-sensitive multiples), the S&P 500’s ability to close above 5,925 cash on volume, and the AVGO print Thursday June 5 after the close where AI segment revenue and FY26 AI guidance are the only lines that move the stock. Layer in the MOVE index above 95 as the cross-asset tripwire for the broader risk leg.
Frequently Asked Questions
Why is AVGO up 5% on June 2 with no news?
The move is positioning ahead of Broadcom’s fiscal Q2 print after the close on Thursday, June 5. June 6 $490 calls are trading at 4.1x normal volume with front-week implied vol at 48%, and the put/call open-interest ratio has dropped to 0.42 from a 0.71 30-day average — directional call-buying without downside hedge, reverse-engineering to AI-segment revenue of $4.7B–$4.9B versus the $4.4B prior guide.
Is the AVGO move a short squeeze?
Statistically no. AVGO short interest is 1.4% of float with days-to-cover at 1.1 per the May 15 NYSE settlement data — multi-year lows that leave essentially no short base to squeeze. The volume signature (1.7x 30-day average) is consistent with leveraged call-buying and dealer gamma hedging, not forced cover.
What is the risk/reward into the June 5 print at $483?
Approximately -12% to the bear case ($425) versus +9.7% to the bull case ($530), based on a soft AI-guide outcome versus a beat-plus-raise. That asymmetry is negative expected value at any bull-case probability below 55%, and the June 6 $490 call’s implied in-the-money probability sits at roughly 48% per the chain — the options market is not pricing the bull case as more likely than coin-flip.
How does today’s gap compare to the prior two AVGO gap-up days?
On May 19, AVGO gapped +4.6% on a Reuters report tying TSMC 3nm allocation to a named hyperscaler — a primary catalyst — and held 78% of that gain into the close. On May 27, AVGO gapped +4.3% on no headline with the same flow signature as today, and faded to close +1.1%, retracing 74% of the intraday peak. Today’s setup matches the May 27 template, not May 19.
What level on the S&P 500 confirms or rejects the breakout?
5,925 cash on the S&P 500 — the gap-resistance formed by the May 28 open and tested unsuccessfully twice this week. A confirmed close above 5,925 on volume north of the 20-day average validates the breakout; a failure with AVGO holding its gains signals megacap detachment, a divergence that historically precedes a 2%–4% mean-reversion within five sessions.
This market commentary is for informational use only. The views expressed are those of the author and do not constitute financial, investment, or trading advice.


