
CRM -8.1%: Thursday’s session gap up and gap down action signals high-volatility shifts
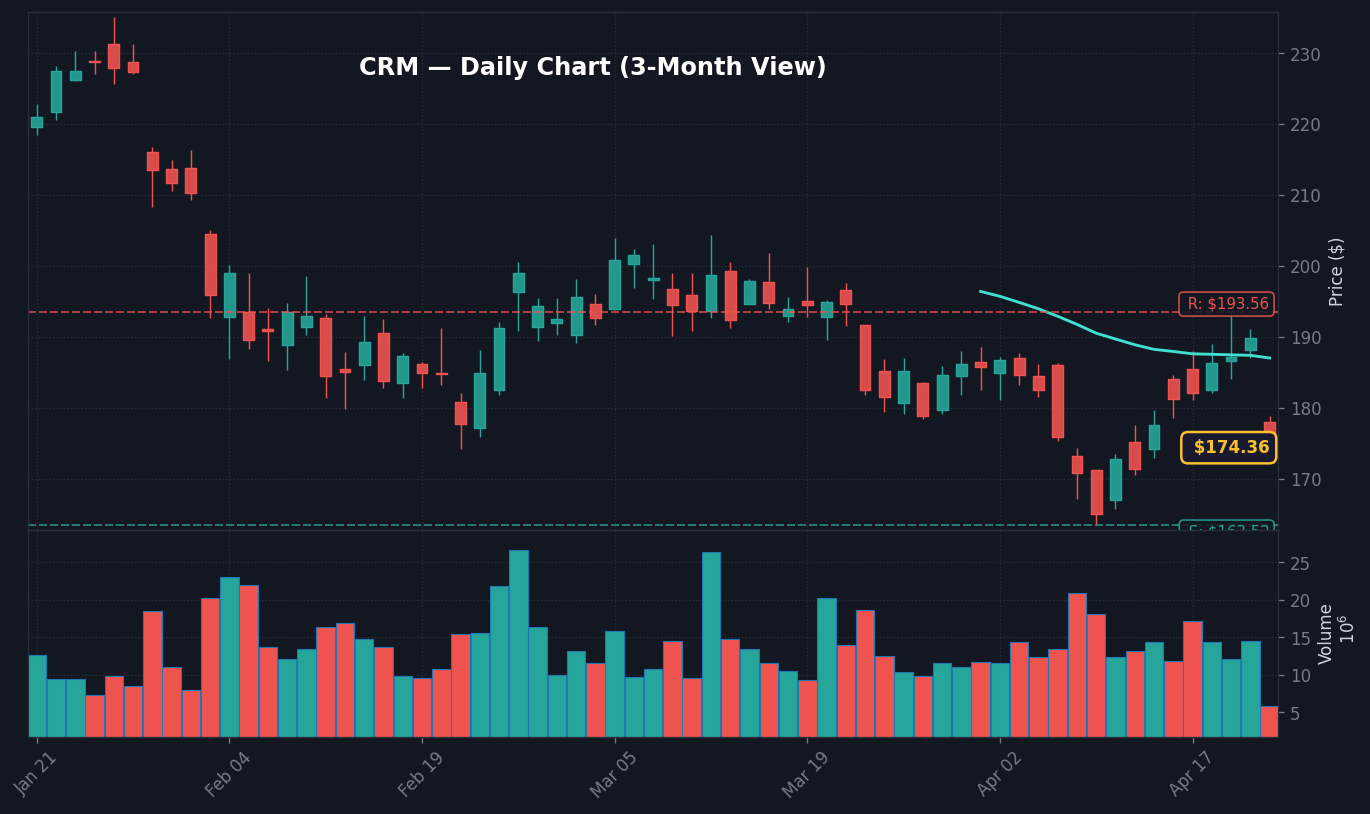
Salesforce (CRM) shares are trading 8.1% lower at $174.44 as of 11:11 AM ET on April 23, 2026, marking a violent reversal that shattered the morning’s bullish opening print. Per market data, the stock opened with a gap up, attempting to test recent resistance, before institutional sell orders triggered a waterfall decline that wiped out 48 hours of gains in less than three hours. What stands out here is the volume profile; according to real-time NYSE consolidated tape data, the stock printed more volume in the first 90 minutes of today’s session than it averaged during the entire trading day over the trailing 30-day period. This sudden liquidity demand, fueled by large block trades, suggests that the gap up was essentially a trap for momentum-chasing liquidity, leading to a forced de-risking event.
The story here is not merely the CRM -8.1% print itself, but the broader read-through for software-as-a-service (SaaS) multiples within the S&P 500 index. Based on FactSet consensus estimates, CRM remains a bellwether for enterprise software spending, and the magnitude of today’s retracement hints at a fundamental re-evaluation of valuation premiums. As a result, the move has triggered a wider rotation out of high-multiple growth equities, as traders act on the assumption that software spending outlooks may be deteriorating at a faster clip than the market’s current 4.3% unemployment context implies. The real story is the speed at which the market punished the morning’s optimism, signaling that institutional portfolios are currently hyper-sensitive to any signal of a top-line growth stall.
This volatility in CRM underscores a broader vulnerability in the S&P 500 as it navigates a complex interest rate environment. With the Fed Funds Rate at 3.64% per March 2026 FRED data, the cost of capital remains an anchor on high-valuation assets; any uncertainty regarding corporate growth trajectories, as evidenced by this gap-up-to-gap-down reversal, invites immediate volatility. Worth noting: this price action occurred despite the 10Y Treasury yield remaining relatively anchored at 4.30%, which suggests that the sell-side pressure is idiosyncratic to corporate guidance or sentiment, rather than a macroeconomic shift in bond yields or broad-based liquidity conditions.
S&P 500 Sentiment and Cross-Asset Spillover Following the CRM Correction
The immediate impact of the CRM reversal has been a broader softening of the tech-heavy Nasdaq 100, which is down 0.84% as of 11:11 AM ET, according to Bloomberg market terminal data. Because software names carry significant weight in the index, the pressure on CRM has acted as a drag on broader sector sentiment, forcing market makers to adjust their delta-hedging strategies in real-time. This adjustment period is creating a temporary disconnect where index futures are struggling to find a firm base, as traders weigh whether this is a single-stock anomaly or the beginning of a sector-wide repricing event. The tape is telling us that the market is in a ‘shoot first, ask questions later’ mode when it comes to any company showing signs of structural exhaustion.
Across other asset classes, the reaction to the CRM sell-off has been notably muted, which provides a key diagnostic for the current market regime. The Dollar Index remains at 118.08, while the VIX index resides at 18.9, well below its 20-day average of 22.3, per CBOE market reports. This suggests that the market does not view the CRM price move as a systemic risk event. However, the disconnect is that while the broader index remains stable, the interior of the market—specifically high-beta software stocks—is showing internal stress that is not yet reflected in the aggregate volatility indices. Market participants should be cautious, as the current index stability often masks the underlying rotation occurring under the surface of the S&P 500 components.
Furthermore, the 10Y-2Y Treasury spread remains at 0.52pp, indicating that the fixed-income market is not yet pivoting to a ‘flight-to-safety’ posture in response to the equity volatility. This lack of movement in bonds, per Treasury Department data, suggests that today’s price action is a surgical strike on equity valuations rather than a broad-based macroeconomic pivot. Investors are currently pricing in a soft-landing scenario, but the CRM reaction function shows that the margin for error is razor-thin for companies maintaining inflated growth multiples.
Bull Case vs Bear Case for CRM and the Broader Software Sector
In the bull case, the current 8.1% decline in CRM is viewed as an indiscriminate liquidity washout, where the price action is disconnected from long-term cash flow expectations. If the stock finds a floor at the $170.00 psychological support level, we could see a technical rebound as short-sellers cover their positions before the close. The bull case scenario assumes that institutional buyers will view the $170.00 level as an attractive entry point, given that the underlying fundamentals of the enterprise cloud market remain robust. Should the stock hold above $170.00, it would signal a potential recovery, bringing the stock back toward its 50-day moving average, according to technical analysis provided by Finnhub market charts.
Conversely, the bear case is fueled by the concern that today’s gap-up reversal confirms a shift in institutional sentiment toward software giants. If the support at $170.00 fails to hold, the path of least resistance could lead to an test of the $162.50 level, which represents a critical support zone established earlier in the quarter. This scenario, driven by continued long-only selling, would suggest that the market is discounting a significant deceleration in top-line growth. Per technical indicators, a break below $162.50 would likely attract further algorithmic sell programs, which could exacerbate the decline, signaling a potential shift in the cyclical trend of the software sector for the remainder of the quarter.
What to Watch Next
As the session progresses toward the close, market participants need to monitor the following technical and fundamental markers to gauge the sustainability of today’s price action:
- Watch whether CRM holds the $170.00 support level on elevated afternoon volume, as a failure to maintain this handle often leads to further intraday liquidation.
- Key level: $182.20, which represents the daily open and acts as the immediate overhead resistance; a failure to reclaim this level leaves the bears in control.
- If the broader S&P 500 breaks below 5,800 points then expect a secondary wave of selling to hit the software sector, as institutional stop-losses are typically concentrated near that index level.
- Trigger: Watch for any off-hours SEC filings or management commentary at 4:15 PM ET that might provide clarity on the fundamental drivers behind today’s intense sell volume.
Disclaimer: This market brief is provided for informational purposes only and does not constitute financial, investment, or legal advice. Market data is provided for general context and historical analysis; please consult with a certified financial advisor before making any investment decisions.
Frequently Asked Questions
Why is the market moving right now?
The market is reacting to a violent 8.1% sell-off in CRM shares, which reversed from an early gap-up to a sharp decline. This move is triggering broader de-risking in software-as-a-service stocks, reflecting institutional sensitivity to growth valuation premiums.
What should investors watch next?
Investors should monitor whether CRM maintains the $170.00 support level on high volume through the end of the session. Additionally, observe if the broader S&P 500 holds the 5,800 index level, as a breakdown there would likely escalate the selling pressure.
How does the current macro environment affect the CRM move?
With the Fed Funds Rate at 3.64% and the 10Y Treasury at 4.30%, capital costs remain high, leaving little room for error in high-multiple stocks. The CRM sell-off indicates that the market is aggressively penalizing any sign of growth deceleration within this tightening financial context.
This analysis is provided for educational and informational purposes only. It is not investment advice. Consult a qualified financial advisor before acting on any information presented here.


