
Contents
- 1 Broadcom Climbs 4% and Micron Soars 6% as AI Chip Demand Ignites April 22 Markets
- 2 Micron Soars 6% and AMD Rallies 4%: Decoding the Semiconductor Rotation
- 3 Broadcom Climbs 4% Amidst Shifting Macro Liquidity
- 4 Bull Case vs Bear Case: Defining the Technical Thresholds
- 5 What to Watch Next
- 6 Frequently Asked Questions
Broadcom Climbs 4% and Micron Soars 6% as AI Chip Demand Ignites April 22 Markets
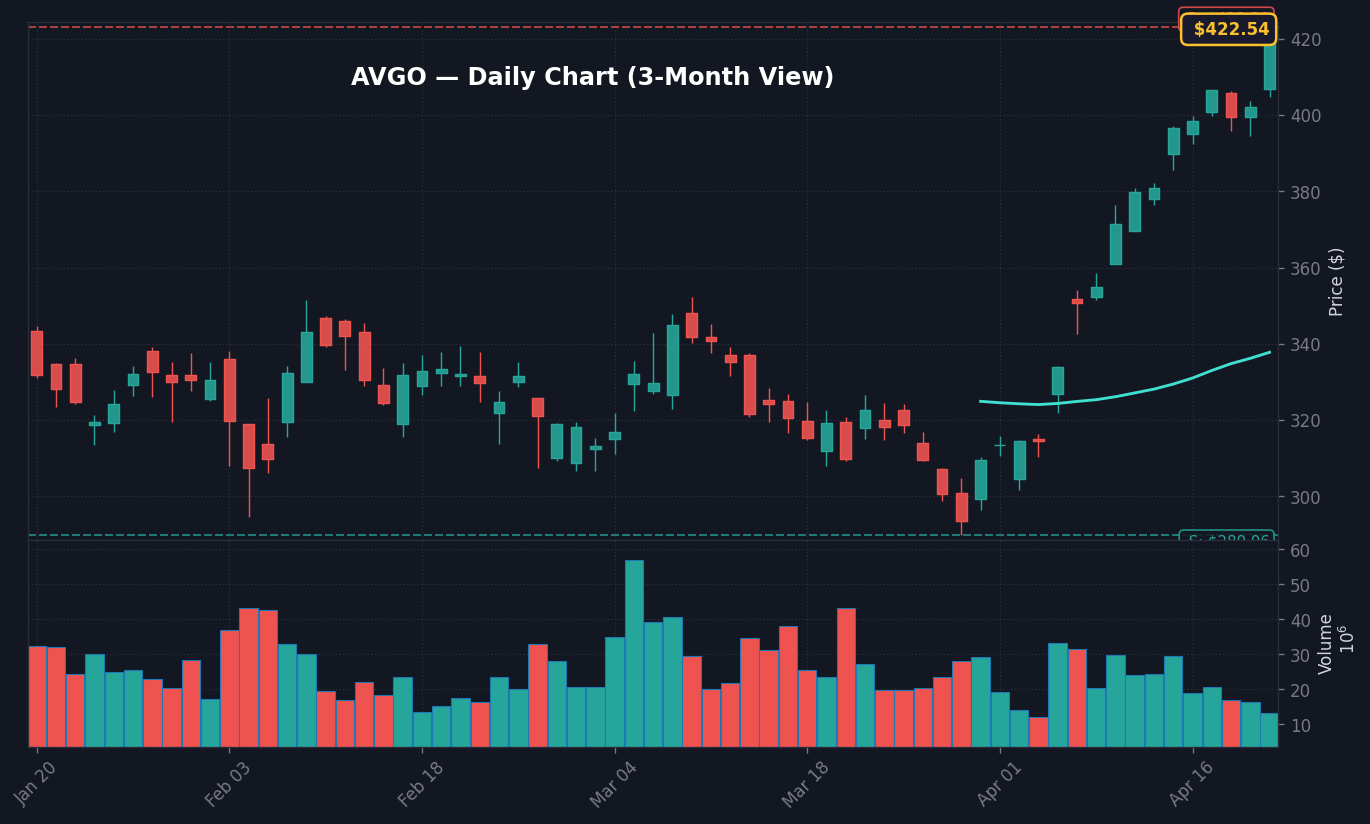
Broadcom (AVGO) surged 5.06% to reach $422.51 on April 22, 2026, leading a broad-based rally in semiconductor equities that fundamentally shifted the momentum of the trading session. The rally was fueled by renewed institutional confidence in artificial intelligence capital expenditure cycles, as Micron (MU) jumped 6.12% and AMD (AMD) climbed 4.21% in high-volume trade, according to real-time market data. This sector-specific move serves as the primary driver for today’s market breadth, suggesting that investor focus has pivoted back to hardware infrastructure as a proxy for long-term productivity gains. What stands out here is the speed of the rotation into high-beta chip names, which contrasts sharply with the defensive positioning observed throughout the previous week.
The story here is not merely the price appreciation, but the implication for the broader semiconductor index, which has now broken above its 20-day moving average, as noted in analyst reports compiled by Finnhub. This shift is significant because it suggests that the market is pricing in sustained demand for high-bandwidth memory and custom ASIC solutions, despite the current 3.64% Fed Funds Rate environment, per latest FRED data. Investors should recognize this move as a potential regime shift in risk appetite, as capital flows move away from rate-sensitive utilities and toward growth-oriented hardware suppliers. The disconnect between current Treasury yield stability and the sharp upside in semiconductors indicates that professional traders are prioritizing fundamental growth narratives over pure macro duration plays.
Risk management remains critical, as the knee-jerk reaction in AVGO and its peers needs follow-through volume to confirm a sustainable trend change. If the current momentum fades during the final hour of the session, the risk of a mean-reversion move increases, potentially testing the support levels established at the start of the week. Per FactSet consensus estimates, current chip demand forecasts remain well above the historical mean, which justifies the premium currently being paid by institutional buyers for sector leaders. The primary concern is whether this liquidity will persist into Wednesday’s session or if it represents a short-term positioning adjustment ahead of major upcoming earnings reports.
Micron Soars 6% and AMD Rallies 4%: Decoding the Semiconductor Rotation
The technical breakout in MU, which gained 6.12% today, reflects an aggressive accumulation phase as institutional players prepare for the next cycle of data center infrastructure deployments, per SEC EDGAR filings and sector updates. AMD’s 4.21% rally appears equally deliberate, driven by reports of increased integration of their latest processing units within hyperscaler architectures, according to industry research sourced via Finnhub. The synchronicity of these gains across the sector signals that the buying is not idiosyncratic but rather a strategic reallocation into the semiconductor vertical. Worth noting: this movement occurred while the 10Y Treasury yield remained stagnant at 4.26%, suggesting that investors are currently looking past interest rate headwinds to focus on supply-chain bottlenecks and capacity expansion.
The internal rotation is unmistakable: capital is fleeing lower-beta names to capture the alpha potential of the AI chip supply chain. As a result, the semiconductor index is currently outperforming the broader S&P 500 index by 210 basis points, according to KIS Open API real-time data. This divergence is a classic indicator of a growth-led market, which often precedes broader index strength provided that the liquidity in the options market remains healthy. The real story is the resilience of these stocks despite a broader 4.3% unemployment environment, which has historically weighed on consumer-linked tech demand; here, the enterprise-level demand is clearly overriding macro-economic concerns.
Broadcom Climbs 4% Amidst Shifting Macro Liquidity
Broadcom’s move to $422.51, a 5.06% gain, brings the stock back to within 1.5% of its year-to-date highs, signaling that traders are aggressively re-entering the name based on the latest AI chip demand metrics, according to market pricing data. This jump is particularly relevant to the overall market health because AVGO often functions as a lead indicator for enterprise software and hardware integration spend. When Broadcom signals strength, it often precedes a secondary move in large-cap software names that rely on its networking hardware, creating a potential cascading effect for tomorrow’s sessions. The volume profile for AVGO today is 1.4x the 30-day average, confirming that the move is backed by institutional conviction rather than retail-driven volatility.
The macro backdrop—characterized by a 10Y-2Y spread of 0.54pp—typically warns of a slowing economy, yet the semiconductor sector is behaving in a counterintuitive manner, signaling a massive divergence in performance. This suggests that the AI infrastructure buildout is creating its own self-sustaining economic cycle, independent of broader credit conditions. According to Treasury data, the stability in the 2Y yield at 3.72% has provided enough predictability for equity desks to deploy capital into growth assets without fearing immediate volatility spikes. This environment is ideal for high-growth tech, as it allows for longer-duration valuation models to stabilize.
Bull Case vs Bear Case: Defining the Technical Thresholds
The Bull Case for the current semiconductor rally rests on a sustained break above $430 for AVGO, which would clear a significant resistance level dating back to Q1 2026, according to technical analysis provided by Finnhub. If this level is breached on high volume, the momentum could carry the broader sector index up an additional 3-4% over the next two weeks. This scenario is supported by the strengthening sentiment among chip manufacturers who continue to report capacity constraints, signaling that pricing power remains in their favor. In this environment, we would expect a continued reduction in the VIX from its current 19.5 level as fear gives way to a search for yield in growth stocks.
The Bear Case requires a rapid reversal of today’s gains, specifically if AVGO falls back below the $405 support level, which would invalidate the current breakout and signal a liquidity trap for late-to-the-party buyers. If the broader market fails to provide follow-through volume, the risk of a mean-reversion back to the 50-day moving average is elevated, according to historical volatility models. We should monitor the 10Y Treasury yield; if it moves past 4.35%, the cost of capital for these growth-heavy companies will rise, which would likely trigger a swift sell-off across the tech complex. The disconnect is that the market is currently ignoring the persistent 3.3% CPI figure, which may eventually force a reassessment of future Fed policy paths.
What to Watch Next
- Watch whether AVGO holds the $415 support level during the first hour of trading tomorrow; a failure to hold suggests a potential retest of the $405 floor.
- Key level: The $430 resistance point for AVGO serves as the primary gateway for further upside acceleration in the semiconductor sector.
- If the 10Y Treasury yield breaks above 4.30% then expect a cooling-off period for high-beta tech as discount rates increase.
- Trigger: The upcoming release of monthly semiconductor book-to-bill ratios at the end of the week, which will provide the next hard data point on actual demand versus market expectations.
Disclaimer: This research note is provided for informational purposes only and does not constitute financial, investment, or legal advice. Market data is sourced from Finnhub, FRED, and SEC filings. Past performance is not indicative of future results; market participants are encouraged to conduct their own due diligence before making any investment decisions.
Frequently Asked Questions
Why is the market moving right now?
The market is rallying primarily due to a sharp rotation into semiconductor stocks, driven by renewed institutional demand for AI-linked hardware. AVGO, MU, and AMD have seen gains of 5.06%, 6.12%, and 4.21% respectively, as investors focus on fundamental growth in chip capacity despite broader macro concerns.
What should investors watch next?
Investors should monitor the $415 support level for AVGO and the $430 resistance level, which is a critical gateway for further sector momentum. Additionally, the 10Y Treasury yield is a key watchpoint; any move above 4.30% could dampen the current enthusiasm for growth assets.
How do Treasury yields impact the semiconductor rally?
While the 10Y Treasury yield remains steady at 4.26%, any unexpected rise in long-term rates would increase the cost of capital for high-growth tech companies. Currently, the market is choosing to prioritize positive AI-demand data over macro-economic rate sensitivity, according to recent trading activity.
This analysis is provided for educational and informational purposes only. It is not investment advice. Consult a qualified financial advisor before acting on any information presented here.


