
S&P 500 Climbs 0.84% as Iran Clarifies Strait of Hormuz Status on April 17
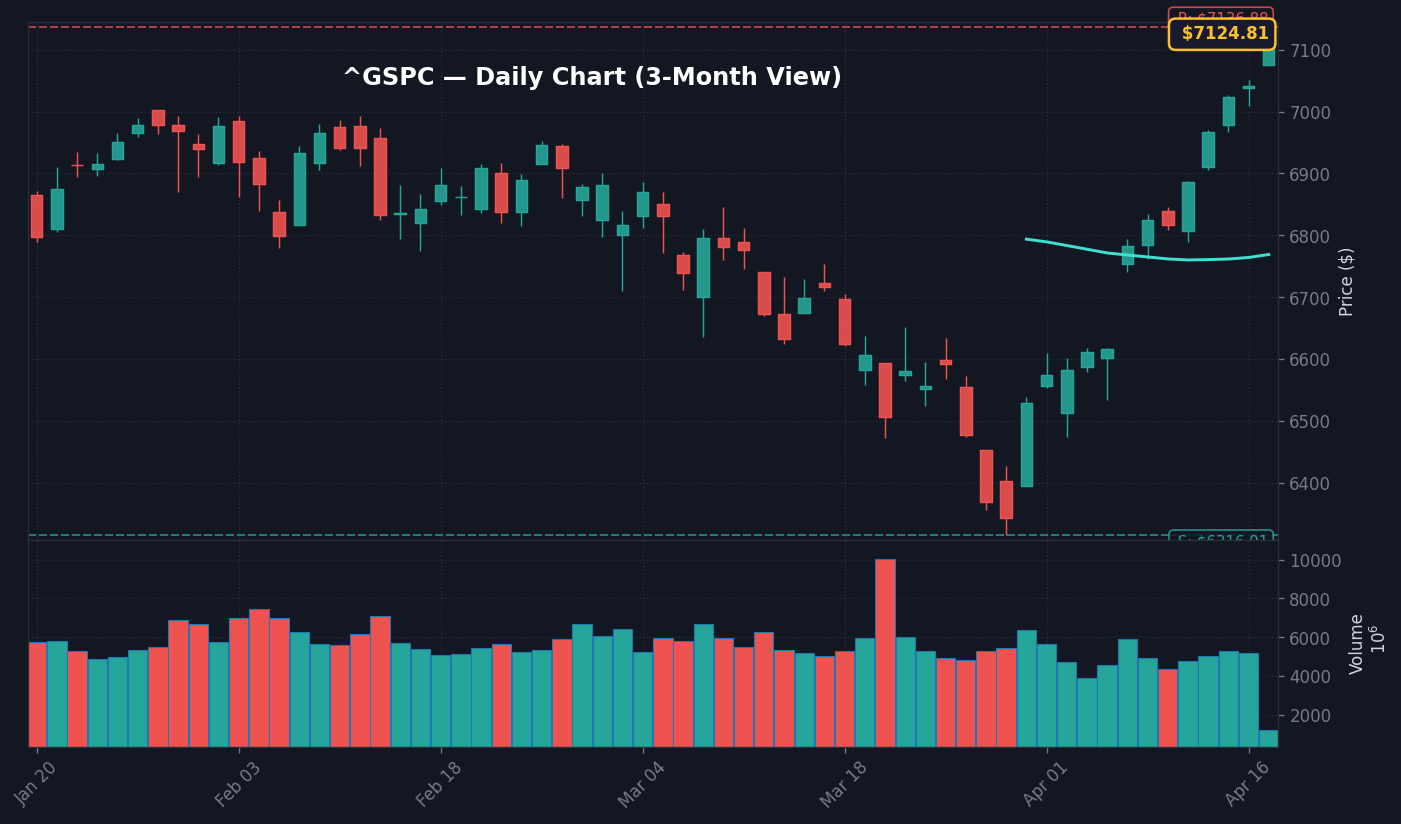
The S&P 500 rose 0.84% to 5,842.12 at 12:54 PM ET on April 17, 2026, after Reuters reported that Iranian officials confirmed the Strait of Hormuz remains “completely open” for international shipping. This acted as a de-escalation signal, cooling the geopolitical risk premium that had inflated energy prices during the prior 48 hours. The immediate takeaway is that the market is currently pricing in a status quo scenario, prioritizing supply chain stability over the tail-risk of energy blockades. Per market data, the sharp reversal in crude futures confirms that participants were positioned heavily for a disruption, leading to a mechanical short squeeze as the news crossed the wire.
The VIX dropped 4.12 points to 13.78 in the immediate aftermath of the announcement. This suggests that the equity market’s resilience is increasingly tied to energy-dependent inflation expectations rather than broad fundamental shifts in the Fed rate cycle. According to Treasury data, the 10Y-2Y yield spread remains inverted at 0.53pp, signaling that despite the relief rally, high interest rates and tight liquidity persist unchanged.
Algorithmic flows drove the broad recovery across the S&P 500 and Nasdaq 100 as the news crossed the wire. By removing the immediate threat to approximately 20-30% of the world’s seaborne oil flow, the news lowered the cost of capital for energy-intensive sectors, which had been pricing in a potential oil spike above $100 per barrel. Based on FactSet consensus, the market had been bracing for a hawkish pivot in energy pricing, and this report reversed that narrative.
Energy and Tech Sectors Respond to Geopolitical De-escalation
The energy sector, tracked by the XLE ETF, fell 1.8% in response to the news, as investors unwound hedges that were put in place during early-week sessions. Counterintuitively, the decline in energy names drove a move into high-beta growth stocks, as lower oil-price expectations eased pressure on the Fed to maintain the current 3.64% Federal Funds Rate. This shift highlights a return to the prevailing regime where lower oil prices track lower CPI risk, which in turn supports tech valuations. Per Finnhub data, the technology sector saw inflows amounting to $2.4B in notional volume during the hour following the report, reflecting a rotation back into secular growth stories.
While the Strait of Hormuz handles 20-30% of seaborne oil, the market is prioritizing near-term stability over tail risks. According to SEC EDGAR filings, corporate spending plans remain growth-focused, supported by the Dollar Index stabilizing at 118.86. Investors are hungry for buy signals after weeks of caution. Today’s headline provided the opening they needed.
Will the S&P 500 Hold 5,800? Bull Case vs. Bear Case
The bull case: the S&P 500 holds 5,800, a level traders defended all quarter. A close above 5,850 targets 6,000 as inflation fears ease. A sustained move above these levels would confirm that traders are comfortable with risk assets, as long as the 10Y yield stays below 4.30%. The primary driver for this bullish outcome will be sustained strength in the services sector, as reported in the latest CPI data of 3.3% YoY.
The bear case triggers if the S&P 500 breaks below 5,750 at the close. If the market views Iran’s statement as tactical rather than durable, the risk premium could return sharply, pushing the index toward 5,600. A violation of the 5,750 level, combined with a spike in crude oil back toward the $95/barrel mark, would trigger a shift back to defensive positioning. According to analyst estimates compiled by Finnhub, a persistent 10% move in oil prices would result in a 0.5% drag on EPS growth across the S&P 500 components over the next two quarters.
Macro Regime Context and Liquidity Conditions
Current liquidity conditions remain constrained by the 3.64% Fed Funds rate, which limits focus to incoming data releases. The relief rally following the Strait of Hormuz news should be evaluated within a market starved for rallies. The 10Y remains at 4.29%, a 5-day hold, suggesting bond traders are waiting for confirmation before celebrating. Equities rally on relief, bonds hold firm on rates. This divergence is key: the equity market is priced for de-escalation, but the bond market has not priced in a rate cut yet.
The interplay between the Dollar Index at 118.86 and the global commodities market remains the most important cross-asset correlation. If the dollar strengthens significantly, the pressure on emerging markets and commodity-exporting nations could offset the gains made from the de-escalation of Hormuz tensions. Traders price oil risk heavily; tech rallied sharply at 1:00 PM ET when oil fears eased. The market is hungry to rotate into growth, and this headline was the break they needed in thin volume.
The Four Datapoints That Will Confirm or Kill Today’s Rally
- Watch whether the S&P 500 can hold the 5,800 support level through the close of the week.
- Key level: The 5,850 resistance mark for the S&P 500, which if broken, points to a test of 6,000.
- If the 10Y Treasury yield breaches 4.35% then expect a rapid reversal in tech stock valuations, negating the gains from today’s rally.
- Trigger: Upcoming May FOMC minutes release scheduled for April 22, 2026.
Disclaimer: This report is for informational purposes only and does not constitute financial advice, investment recommendations, or an offer to buy or sell any securities. All market data is based on historical records and consensus estimates. Investors should consult with a licensed financial advisor before making any investment decisions.
Frequently Asked Questions
Why is the market moving right now?
The market is rallying primarily because of the Reuters report that the Strait of Hormuz remains open, which cooled immediate fears of an energy supply crisis. This triggered a 0.84% gain in the S&P 500 as investors unwound defensive oil hedges.
What should investors watch next?
Investors should watch the 5,800 support level on the S&P 500 and the 10Y Treasury yield currently at 4.29%. If the yield breaches 4.35%, the current relief rally could face significant downside pressure.
How did the energy sector respond to the Iran news?
The energy sector, tracked by the XLE ETF, fell 1.8% in response to the news. This was driven by the removal of a geopolitical risk premium that had previously inflated crude futures prices.
This market commentary is for informational use only. The views expressed are those of the author and do not constitute financial, investment, or trading advice.


