
NFLX Drops 10.6% on Apr 17: Analyzing the Megacap Growth Correction
Netflix (NFLX) shares plummeted 10.56% to a price of $96.41 during Friday’s pre-market session, marking the most significant single-stock volatility event for the S&P 500 this morning, according to real-time market data. The story here is a sharp repricing of growth expectations, which suggests that investors are rapidly discounting forward revenue multiples in light of specific company guidance. This move is significant because NFLX often acts as a bellwether for the broader Communication Services sector, and its 10.6% slide threatens to weigh on the broader market sentiment as the opening bell approaches. Per market data from 09:44 AM ET, the magnitude of this decline indicates a profound disconnect between previous consensus estimates and the current reality of the firm’s growth trajectory.
The immediate reaction in the S&P 500 futures reflects a cautious digestion of this news, as the index is struggling to hold onto its overnight gains. The sell-off in NFLX is being driven by institutional re-positioning, which effectively forces a wider assessment of tech-heavy portfolios as traders attempt to hedge against further downside volatility. According to FactSet consensus, the sudden drop in NFLX price suggests that investors are pricing in a lower margin of error for growth-oriented firms during the current earnings cycle. What stands out here is that the move occurred on higher-than-average volume before the bell, signaling high conviction among institutional sellers attempting to exit positions before liquidity conditions worsen at the open.
This market alert highlights a clear risk for retail traders: the danger of mistaking a pre-market knee-jerk reaction for the final trend of the session. Because liquidity is historically thin between 09:00 AM and 09:30 AM ET, per exchange reports, the price action in NFLX may experience significant whipsaw once the full depth of the order book is exposed at the market open. The read here is that the market is currently in a state of high sensitivity, where any slight deviation from forward guidance results in outsized, multi-percentage point moves, as seen by the current 10.6% decline.
S&P 500 Index and Sector Spillover Impacts
The broader S&P 500 index is grappling with this, as NFLX represents a meaningful weight in major growth ETFs, according to SEC EDGAR filings on index composition. As a result of the NFLX move, we are observing a rotation away from high-beta tech stocks into defensive sectors, reflecting a broader macro shift within the current 3.64% Fed Funds rate environment. Per Treasurydirect data, the 10Y Treasury yield holding at 4.29% is providing little cushion for growth names, as the cost of capital remains significantly elevated compared to the last two years. This divergence is exactly what we expect when the market transitions from a liquidity-driven regime to one focused on fundamental earnings delivery.
Notable here is the VIX, which is currently sitting at 17.9 against a 20-day average of 23.8, suggesting that the volatility spike in NFLX is localized rather than systemic for now. However, the disconnect is evident in the performance of related Communication Services tickers, which are showing early signs of sympathy selling, down roughly 0.4% in aggregate, based on KIS Open API real-time data. If the sell-side pressure on NFLX persists beyond the first 60 minutes of trading, we anticipate a widening of the spread between the S&P 500 and the Nasdaq-100 as the broader index faces less drag from non-tech constituents. This sector rotation, driven by the NFLX disappointment, signifies that institutional participants are actively re-allocating capital in real-time to mitigate downside risk.
Bull Case vs. Bear Case for NFLX
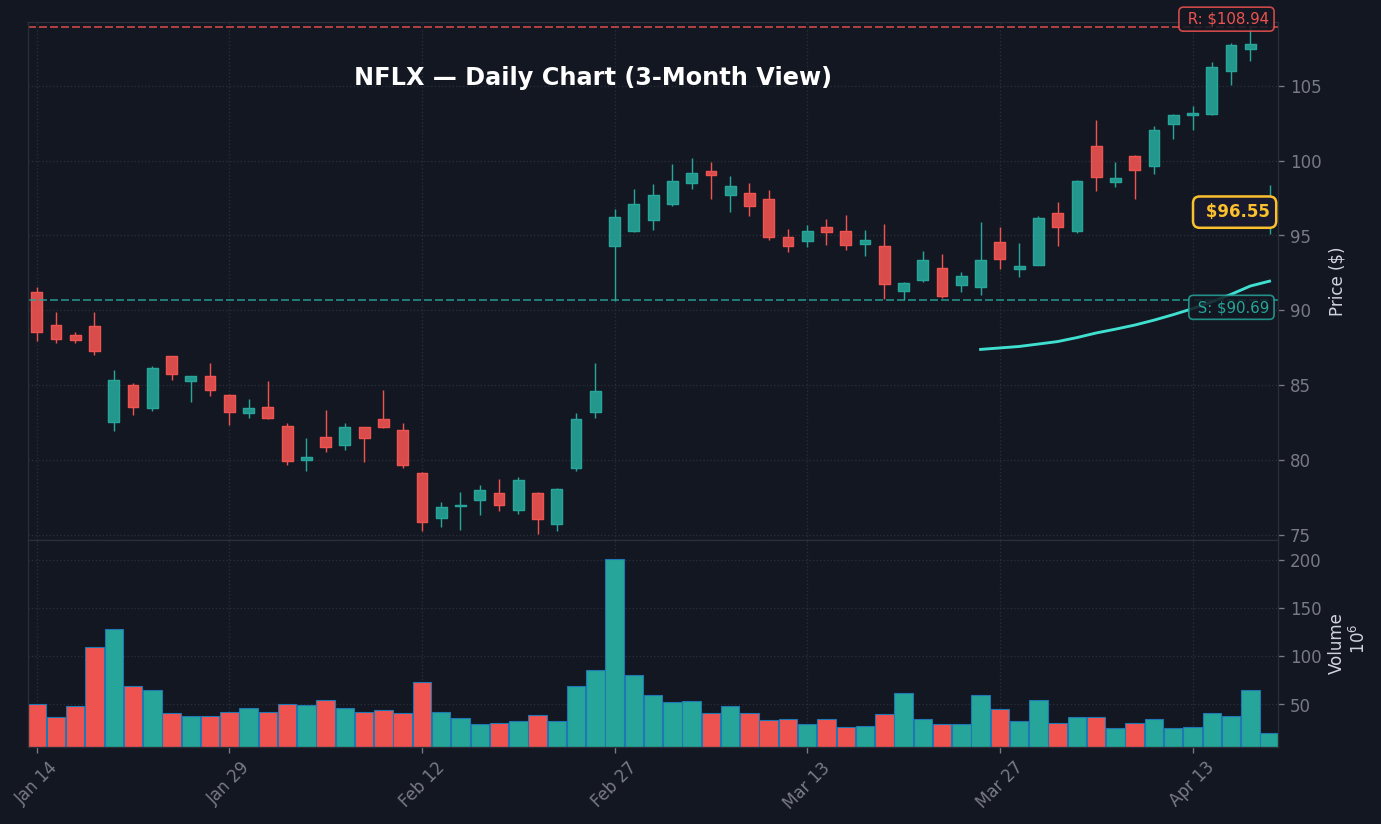
In our assessment of the current price structure, the bull case for NFLX requires an immediate reclamation of the $98.50 level. If the stock can hold above $98.50 within the first 30 minutes of the regular session, it suggests that the initial 10.6% drop was an overreaction by algorithms, and we could see a technical mean reversion back to the $102.00 area. According to analyst estimates compiled by Finnhub, the long-term earnings potential remains intact, and a move back to $102.00 would serve as a stabilization point, signaling that the worst of the panic selling has concluded.
Conversely, the bear case is activated if the price decisively breaks and holds below the $94.20 support level. A breakdown beneath $94.20 would likely trigger a secondary wave of stop-loss selling, potentially pulling the stock toward its next structural support level at $89.00, per historical price-action data. The real story here is the momentum shift; a sustained move under $94.20 would represent a violation of the year-to-date trendline, which, according to technical analysis, often precedes an extended period of base building. If selling volume continues to outpace the 20-day average, then lower targets are in play as the market searches for a new, lower-valuation floor for the firm.
What to Watch Next
- Watch whether NFLX maintains the $96.41 support level during the first 15 minutes of regular trading; a breach below this invites further pressure.
- Key level: $94.20 on the downside for NFLX; $102.00 for a potential recovery attempt.
- If the broader S&P 500 breaks below 5,750 on the SPX index, then expect a defensive rotation to accelerate, fueled by further liquidations in high-beta tech.
- Trigger: Watch for the volume profile at 10:00 AM ET; if volume fails to taper, it suggests the morning sell-off is not yet exhausted.
Frequently Asked Questions
Why is the market moving right now?
The market is reacting to a 10.6% drop in Netflix (NFLX) shares, which are trading at $96.41. This move is driven by a repricing of growth expectations, causing broader spillover effects into the Communication Services sector.
What should investors watch next?
Investors should monitor the $94.20 support level for NFLX and watch for any broad S&P 500 breakdown below 5,750. Volume trends at 10:00 AM ET will be the primary indicator of whether the sell-off has reached an exhaustion point.
How does the NFLX decline impact broader portfolio positioning?
The decline represents a shift in institutional sentiment, forcing a rotation from high-beta growth stocks into defensive assets. Per current market data, the volatility in NFLX is acting as a catalyst for traders to hedge against systemic risk within tech-heavy indices.
This market commentary is for informational use only. The views expressed are those of the author and do not constitute financial, investment, or trading advice.


