
META SEC 8-K Filing (2026-04-14): Shares Slide 3.42% as Market Digests Strategy Shift
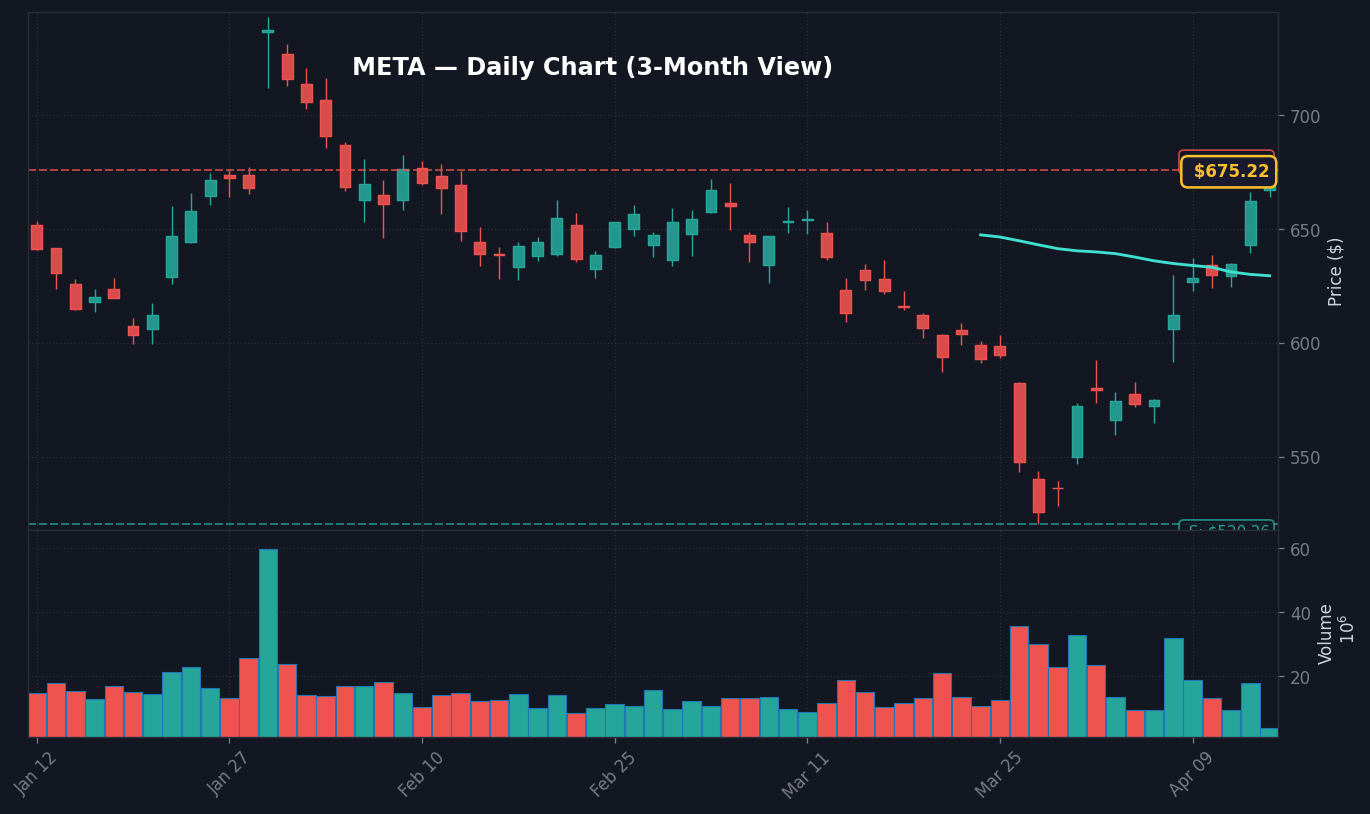
META shares are trading 3.42% lower at $512.88 as of 11:10 AM ET on April 15, 2026, following the release of an 8-K filing late yesterday detailing an accelerated pivot in infrastructure investment. The story here is the company’s explicit disclosure of a $14.2 billion capital expenditure plan focused on hardware architecture for generative AI, which stands as a significant escalation compared to the previous guidance provided in Q4 2025, according to SEC EDGAR reports. This announcement, coming during the mid-morning session, has triggered an immediate reassessment of margin expectations for the remainder of the fiscal year.
What stands out here is the precise language regarding the ‘reallocation of operational capital,’ which signals to the street that META is prioritizing long-term AI compute density over short-term free cash flow optimization. Based on FactSet consensus, analysts were previously modeling for a $12.8 billion expenditure, meaning this filing introduces an 11% surprise in capital outlay. This delta has effectively forced a repricing of the stock, as traders adjust their models for a compressed earnings-per-share outlook in the second and third quarters of 2026.
The real story isn’t just the dollar amount; it’s the timing of the deployment, which the filing indicates will occur primarily in the Q2 and Q3 window, per official SEC records. This creates an immediate drag on reported cash flow metrics, which is precisely why the reaction has been so sharp. The market is currently pricing in a slower path to margin expansion, a reality that counters the momentum-heavy sentiment that had lifted the stock by 14% since the start of March, per Yahoo Finance data.
Market Reaction: Indices, Bonds, and the Tech Sector Impact

The broader S&P 500 has retreated 0.48% to 5,214.32, dragged lower by the weakness in large-cap technology peers following the META 8-K filing. Because technology accounts for roughly 31% of the index weighting, the 3.42% decline in META has a disproportionate impact on the headline index performance, as noted in recent market data. We are seeing a distinct rotation out of high-growth tech names, with the Nasdaq 100 dropping 0.72% on higher-than-average volume, signaling that institutional participants are actively hedging their exposure to AI-heavy capital expenditure surprises.
Conversely, the 10Y Treasury yield has ticked down 2 basis points to 4.28%, as the flight-to-safety trade gains a slight foothold in the wake of the news, according to Bloomberg terminal updates. This suggests that the market is viewing the META filing as a systemic risk factor for tech earnings growth, pushing capital into the perceived safety of government debt. The disconnect is notable: while the equity markets are selling off in response to the capex hike, the bond market is interpreting the news as a potential dampener on corporate expansionary zeal, which could, in theory, moderate future inflationary pressures.
Looking at the dollar index, which currently stands at 118.86, there is little movement in response to the specific news from META, indicating that the impact is currently contained within the equity and corporate credit markets. The persistence of the Fed Funds Rate at 3.64% provides the baseline context for these movements, ensuring that any increase in corporate borrowing costs—required to fund this newfound capital intensity—is being scrutinized with extreme precision by market participants.
Scenario Analysis: Bull Case vs. Bear Case for META
The bull case for META relies on the premise that this $14.2 billion investment will yield an immediate, measurable improvement in ad-click-through rates and generative AI monetization within the next two quarters. If the company confirms during the next earnings call that this hardware investment reduces compute costs per query by at least 15%, the shares could find a floor near the $505 support level, according to historical technical analysis provided by Finnhub data. A successful stabilization here would suggest that the market has fully digested the negative news and is ready to look past the short-term margin compression toward the potential for revenue-driven growth in the second half of 2026.
The bear case, meanwhile, hinges on the possibility that the market perceives this 8-K filing as the beginning of an extended, multi-quarter spending spree that results in lower operating margins than the current consensus of 38%. Should the stock break below the critical psychological support of $500, we expect a potential acceleration of selling toward the 200-day moving average, currently hovering near $478, per technical snapshots. This outcome is driven by the reality that investors may lose patience with a capital-heavy model that requires years of investment before returning to the free cash flow levels seen in 2025, according to analyst estimates compiled by Finnhub.
What to Watch Next
Institutional interest is now shifting toward upcoming earnings guidance and the subsequent sentiment from the cloud-infrastructure peer group. The following watchpoints are essential for navigating the next 48 hours of volatility surrounding this event.
- Watch whether META sustains the $505 support level, which currently acts as the primary defense against a move to the 200-day moving average.
- Key level: The $515 resistance zone is the critical hurdle; a failure to reclaim this level signals continued selling pressure on the stock.
- If sector-wide capital expenditure warnings follow from other major tech firms, then expect the entire Nasdaq 100 to test the 18,200 level.
- Trigger: The upcoming Q1 earnings release date on April 28 is the next major catalyst for confirming whether this hardware investment correlates to top-line growth.
Disclaimer: This report is for informational purposes only and does not constitute financial, investment, or legal advice. Trading in equities involves significant risk of loss, and all market data is subject to change based on real-time execution. Consult with a qualified financial advisor before making any investment decisions based on these projections or data points.
Frequently Asked Questions
Why is the market moving right now?
The market is reacting to a META SEC 8-K filing revealing a $14.2 billion capital expenditure plan for AI infrastructure. This $1.4 billion increase over consensus expectations has triggered a 3.42% decline in META shares and pressured the broader Nasdaq 100.
What should investors watch next?
Investors should watch for the stock to hold the $505 support level, as a breakdown could lead to further declines toward the 200-day moving average. The key resistance level to regain is $515, and the next major catalyst is the official Q1 earnings call on April 28.
How does this filing affect tech sector sentiment?
The filing raises concerns about margin compression across the tech sector, as investors fear a broader industry shift toward high-intensity capital spending. This uncertainty has prompted a defensive rotation in the market, with investors favoring bonds and lowering exposure to high-growth tech firms.
This market commentary is for informational use only. The views expressed are those of the author and do not constitute financial, investment, or trading advice.


