The S&P 500 is trading up 0.02% at 7510.86 at 10:00 AM ET, yet the headline stability masks a widening divergence between cyclicals and duration-sensitive growth, per Market Data.
This market alert is high priority because the Nasdaq Composite is down 0.25%, the Dow Jones is up 0.40%, and the VIX is up 0.65% to 17.16, per Market Data. The tape is not showing a clean risk-on move; it is a rotation cycle where cyclicals and defensives are sending conflicting messages simultaneously.
The driver is not a named Fed, BLS, SEC, EIA, or company-wide shock. The first-order consequence is read from the 10:00 AM ET market map: Materials +1.47%, Energy +1.35%, Utilities +1.18%, and Technology -0.28%, per Market Data.
The key risk is that traders treat the initial move as the full message before volume and catalyst confirmation arrive. The index remains above its 50-day SMA at 7472.14, but the 10-year Treasury yield at 4.64% and sticky CPI at 3.7% constrain the upside thesis, per Market Data and FRED data.
How Did the 4.64% 10-Year Yield Shape the July 22 Rotation?
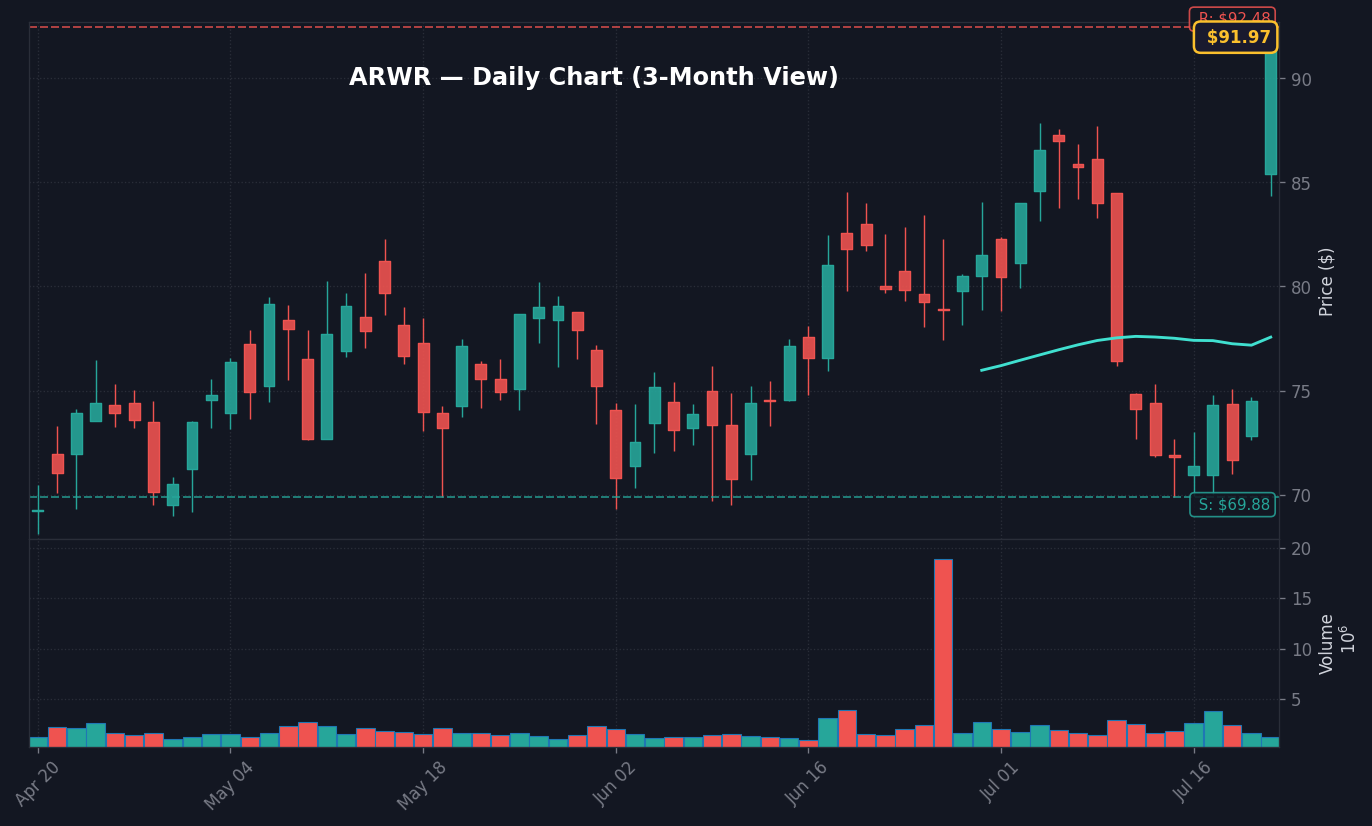
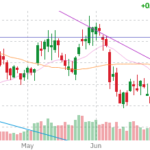
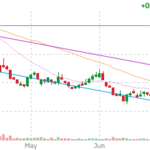
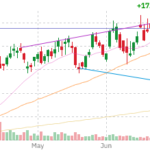
ARWR Daily Chart — 3-month view with SMA50/200
The 10-year Treasury yield is at 4.64, up 0.30% on the session, while the latest FRED snapshot showed the 10-year at 4.60% with a 5-day change of +2bp as of July 20. This rate level matters because sticky inflation keeps duration-sensitive equities under pressure when CPI is still 3.7% year over year and the fed funds rate is 3.63%, per FRED data.
The cross-asset bridge is the curve. FRED data shows the 2-year Treasury at 4.21% and the 10-year minus 2-year spread at 0.39 percentage points, which indicates the equity market is not trading a classic recession scare at 10:00 AM ET. It is trading a stickier-rate regime where long-duration growth stocks need stronger earnings proof to outrun the discount-rate drag.
The overlooked signal is the dollar. The broad Dollar Index is 120.53, down 0.17% over five days, per FRED data. If the Nasdaq were selling off because of a broad dollar squeeze, the currency signal would look more forceful. Instead, the pressure comes from the rate-equity channel: a 4.64 10-year yield and Nasdaq futures down 0.49%, per Market Data.
The S&P 500 level at 7472.14 is vital. The index can absorb a rotation while it stays above the 50-day SMA, per Market Data. A break below that level changes the message from sector sorting to trend deterioration, especially because MACD is 17.5859 versus a signal line at 22.3806 with no crossover, per the supplied S&P 500 technical indicators.
Which Stocks Are Carrying 10:00 AM: OTLY +28.62%, SMCI +22.31%, ARWR +21.50%
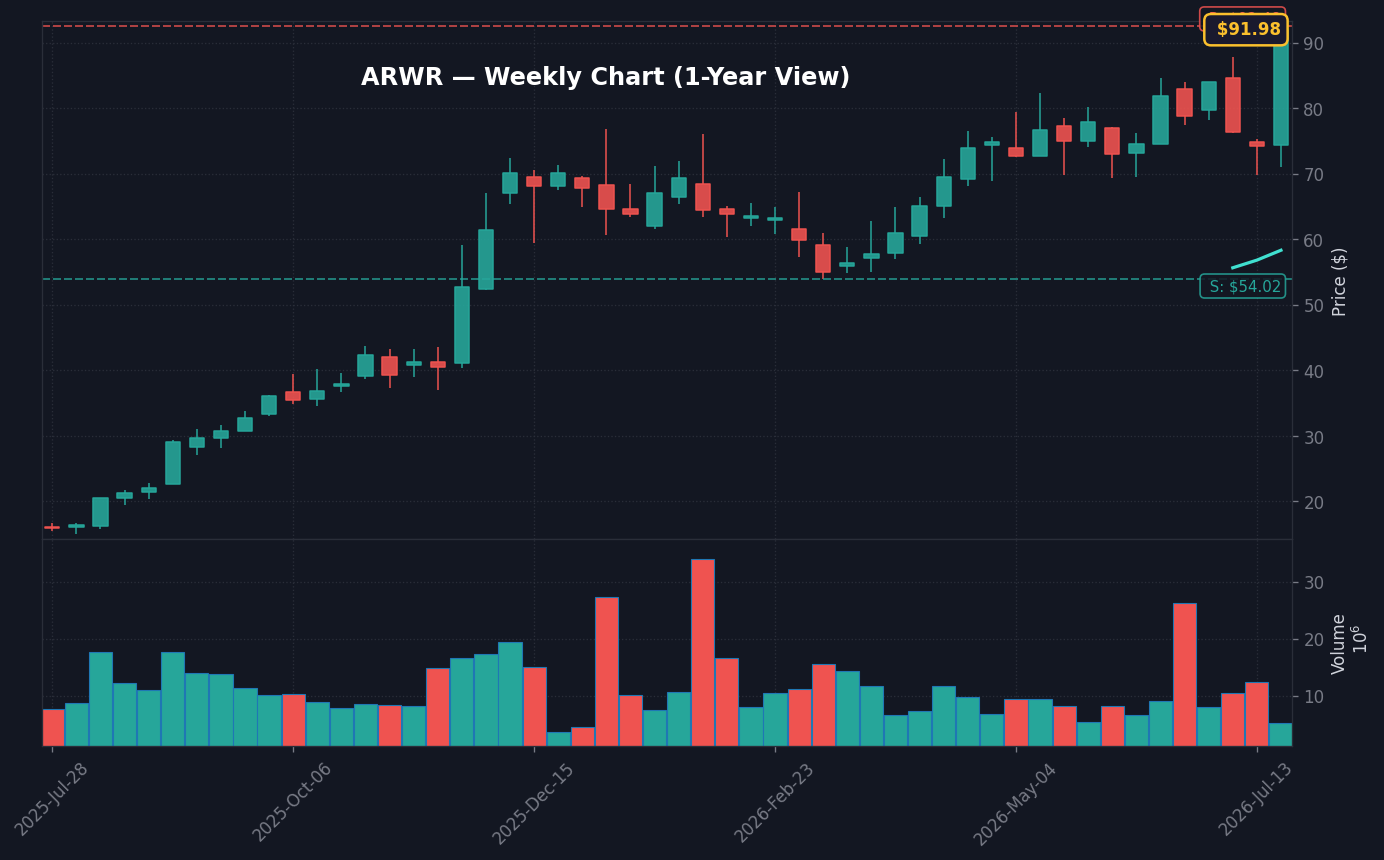
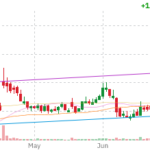
ARWR Weekly Chart — 1-year view with SMA50/200
OTLY is the clearest single-name catalyst in the data, trading at 11.64 and up 28.62% after second-quarter revenue beat forecasts and the outlook improved, according to the supplied company earnings release and Market Data. This is a stock-specific move, not a macro signal by itself.
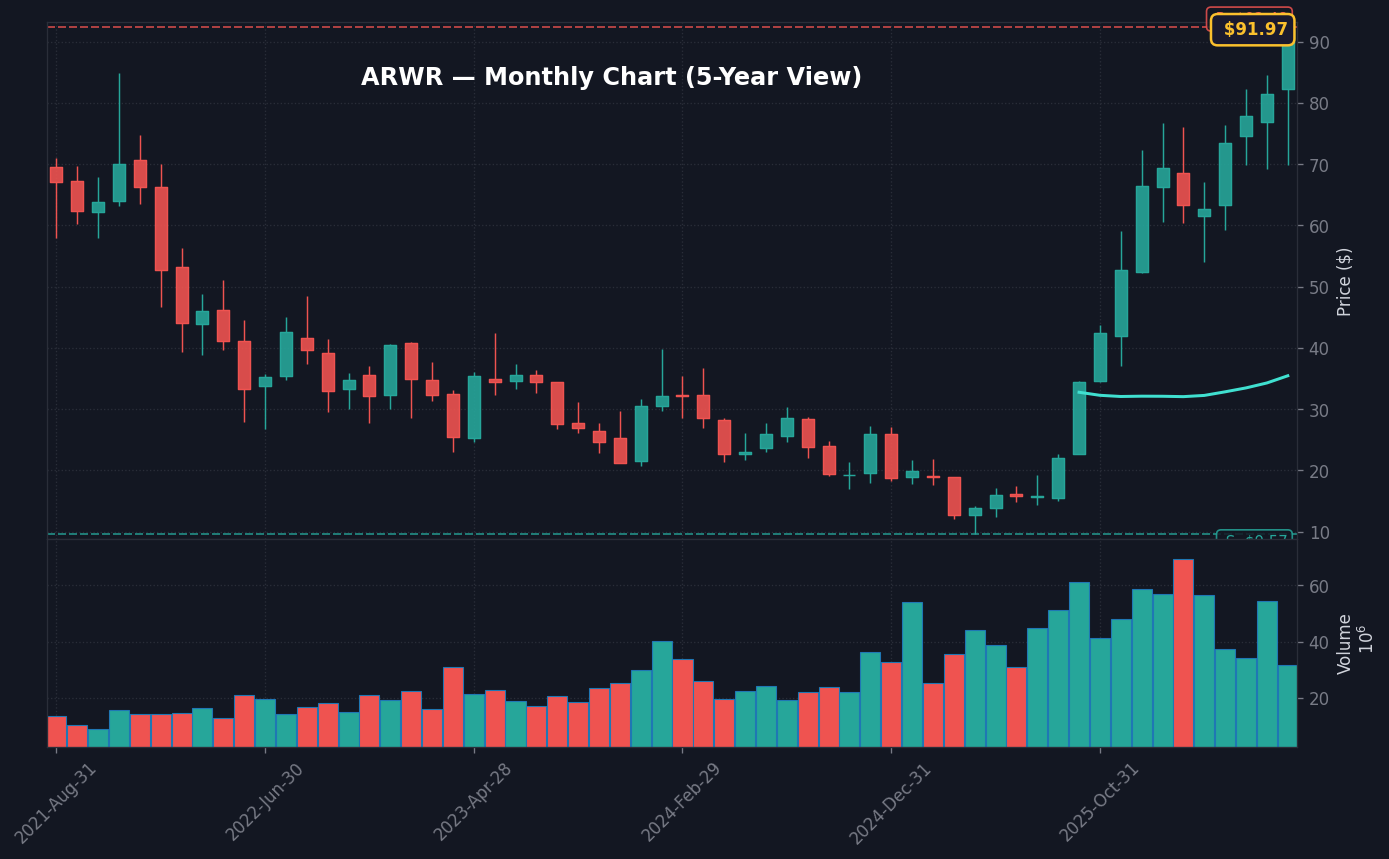
SMCI is up 22.31% to 31.19 and ARWR is up 21.50% to 90.54, per Market Data. No company-specific catalyst for SMCI or ARWR was supplied in the event feed. In a breaking tape, this distinction matters. A price move without a named catalyst can be tradable, but it is not proof that the entire market has shifted regimes.
DELL is up 8.89% to 439.99, CRWV is up 5.85% to 84.23, AMD is up 1.46% to 552.41, and NVDA is up 0.15% to 207.60, per Market Data. This is not enough to declare a full technology rebound because the Technology sector is still down 0.28% and Nasdaq futures are down 0.49%, per Market Data. The stronger read is narrower: selected hardware and compute names are catching bids, while the sector aggregate remains capped by rates and valuation discipline.
The laggard board makes the alert more serious. PEGA is down 14.19% to 26.55, RDDT is down 9.26% to 168.76, PATH is down 8.27% to 11.04, and TEL is down 7.86% to 192.66, per Market Data. Software and internet weakness has more index significance than a single micro-cap squeeze because those groups sit closer to the Nasdaq duration trade.
The signal is that traders are rewarding idiosyncratic earnings beats and hard-catalyst stories, but they are not paying up for the whole growth complex. Leadership is becoming more conditional; stocks that only depend on lower rates have less room while the 10-year sits at 4.64.
What the Tape Is Not Pricing Yet: VIX 17.16 and CPI 3.7%
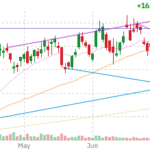
ARWR Monthly Chart — 5-year view with SMA50/200
VIX is at 17.16, up 0.65%, versus a 20-day average of 16.9, per Market Data and FRED data. The VIX rising while the S&P 500 is up 0.02% is the cleanest warning that traders are paying for protection under the surface.
The tape is not pricing the cost of being early. In a sticky CPI regime with CPI at 3.7% year over year and fed funds at 3.63%, per FRED data, the market lacks an easy multiple-expansion argument. A flat S&P 500 can look stable on a quote screen, but if yields hold at 4.64 and Nasdaq futures stay negative, the burden shifts back to earnings quality and cash-flow durability.
Real Estate is down 0.22% and Healthcare is down 0.25%, per Market Data. Those are not the largest sector moves, but they show the defensive bid is selective. The disconnect is that the index looks calm while the internal map is already choosing winners and losers.
Technically, the S&P 500 is not broken. RSI(14) is 52.75 and the index is above its 50-day SMA at 7472.14, per the supplied S&P 500 technical indicators. That keeps the base case intact. However, MACD at 17.5859 below the 22.3806 signal line means momentum has not provided a clean bullish confirmation.
This is where traders make the wrong inference. A flat S&P 500 does not mean the market has absorbed the alert. The confirmation must come from the 7472.14 level, Technology turning positive from -0.28%, and VIX slipping back below the 16.9 20-day average.
Three Scenarios Around S&P 500 7510.86 and 7472.14
The asymmetry is tight because the S&P 500 is only 38.72 points above its 50-day SMA, based on the supplied S&P 500 level of 7510.86 and 50-day SMA of 7472.14. This is the nearest actionable risk line. Above it, the market maintains this rotation; below it, the tape looks like failed support.
3 Scenarios From Here
Bull: S&P 500 holds above 7510.86 and futures stabilize above 7539.75 into the July 22 cash close, while Technology improves from -0.28% → rotation broadens without losing the 7472.14 SMA 50.
Base: S&P 500 trades between 7472.14 and 7539.75 through the July 22 session, while VIX stays near 17.16 and the 10-year yield holds around 4.64 → choppy sector rotation remains the dominant message.
Bear: S&P 500 loses 7472.14 while Nasdaq futures remain below 29171.5 and VIX stays above its 16.9 20-day average → the market alert shifts from rotation risk to trend-risk confirmation.
The bull case requires breadth improvement, not just a handful of gainer-board spikes. For the bull case to earn credibility, the market needs the growth complex to stop lagging while the S&P remains above 7472.14.
The base case is the most honest one at 10:00 AM ET because the hard data is balanced. The S&P 500 is positive by only 0.02%, Dow futures are up 0.25%, and S&P 500 futures are down 0.08%, per Market Data. This mix supports a range trade.
The bear case starts if the market stops respecting the 50-day SMA at 7472.14. If 7472.14 breaks while VIX is still above the 16.9 20-day average, the market message becomes less about leadership and more about protection.
Key Levels: 7472.14 SMA Support
Watch whether the S&P 500 stays above 7472.14 while Technology improves from -0.28% and Nasdaq futures recover from 29171.5; this would confirm a rotation-driven floor.
Key trigger: 7472.14 (S&P 500 50-day SMA); a sustained hold confirms the uptrend, while a break invalidates the rotation thesis and confirms trend-risk.
If VIX remains above its 16.9 20-day average while the 10-year yield holds near 4.64, then traders should expect more pressure on Nasdaq leadership.
Next Session Watchpoints
Volume profile: Watch whether ARWR keeps at least 0.9x average.
Key level to watch: Use today’s nearest actionable S&P 500 level from the supplied technicals and explain why it matters. is the pivot for continuation.
Catalyst quality: The move needs follow-through headlines or clean price acceptance above the pivot.
Risk trigger: If ARWR loses the opening range quickly, the move shifts from continuation to fade risk.
Frequently Asked Questions
Why is the S&P 500 barely positive on July 22, 2026?
The S&P 500 is up 0.02% at 7510.86 because Materials, Energy, Utilities, and Industrials are offsetting weakness in Technology, Healthcare, and Real Estate, per Market Data. The alert is rotation-driven, not a clean broad-market breakout.
What S&P 500 level matters most after the 10:00 AM ET market alert?
The nearest actionable level is 7472.14, the S&P 500 50-day SMA from the supplied technical indicators. A hold keeps the tape in rotation mode, while a break would shift the message toward trend-risk confirmation.
Why are traders watching the 10-year yield and VIX with Nasdaq down 0.25%?
The 10-year Treasury yield is at 4.64 and VIX is at 17.16, both important because sticky CPI at 3.7% limits the case for fast rate relief, per Market Data and FRED data. That combination pressures long-duration growth while Nasdaq Composite trades down 0.25%.