269 bps is the number that matters this week: HY OAS is sitting at the 4th percentile, keeping the July 22, 2026 US macro regime in EXPANSION despite sticky 3.4% Core PCE, per the pre-analyzed signal data.
| Indicator | Current | 52W Rank | 4W Trend | Range |
|---|---|---|---|---|
| Fed Funds Rate | 3.63% | 13th pct | → stable | 52w: 3.62 – 3.89 |
| 10Y–2Y Spread | 0.37% | 6th pct | ↑ rising | 52w: 0.27 – 0.74 |
| HY Credit Spread (OAS) | 269 bps | 4th pct | → stable | 52w: 263.0 – 346.0 |
| Initial Claims (weekly) | 208,000 | 12th pct | ↓ falling | 52w: 190000.0 – 259000.0 |
| CPI YoY | 3.7% | 83th pct | ↓ falling | 52w: 2.38 – 4.27 |
| Core PCE YoY | 3.4% | 100th pct | ↑ rising | 52w: 2.75 – 3.41 |
| Consumer Sentiment | 45 | 0th pct | ↓ falling | 52w: 49.8 – 74.0 |
| 30Y Mortgage Rate | 6.55% | 76th pct | → stable | 52w: 5.98 – 6.89 |
| M2 Growth YoY | 5.6% | 100th pct | ↑ rising | 52w: 3.85 – 5.58 |
269 bps HY OAS Says Expansion Is Still the Base Case
The regime call is expansion because the three cleanest cyclical signals are aligned: the 10Y-2Y spread is positive at +0.37%, HY OAS is tight at 269 bps, and initial claims are low at 208,000, per FRED Official data and the pre-analyzed signal data. That combination says the market is not paying recession insurance in credit, the curve is no longer inverted, and the labor market is not breaking.
Credit is the anchor. HY OAS at 269 bps sits in the 4th percentile of the last 52 weeks, with a stable four-week trend of +3 bps and a 52-week range of 263.0 to 346.0 bps, per the pre-analyzed signal data. In plain equity terms, creditors are still accepting tight compensation for default risk. That is exactly what an expansion tape should look like: equity multiples can hold because the bond market is not forcing a balance-sheet stress narrative.
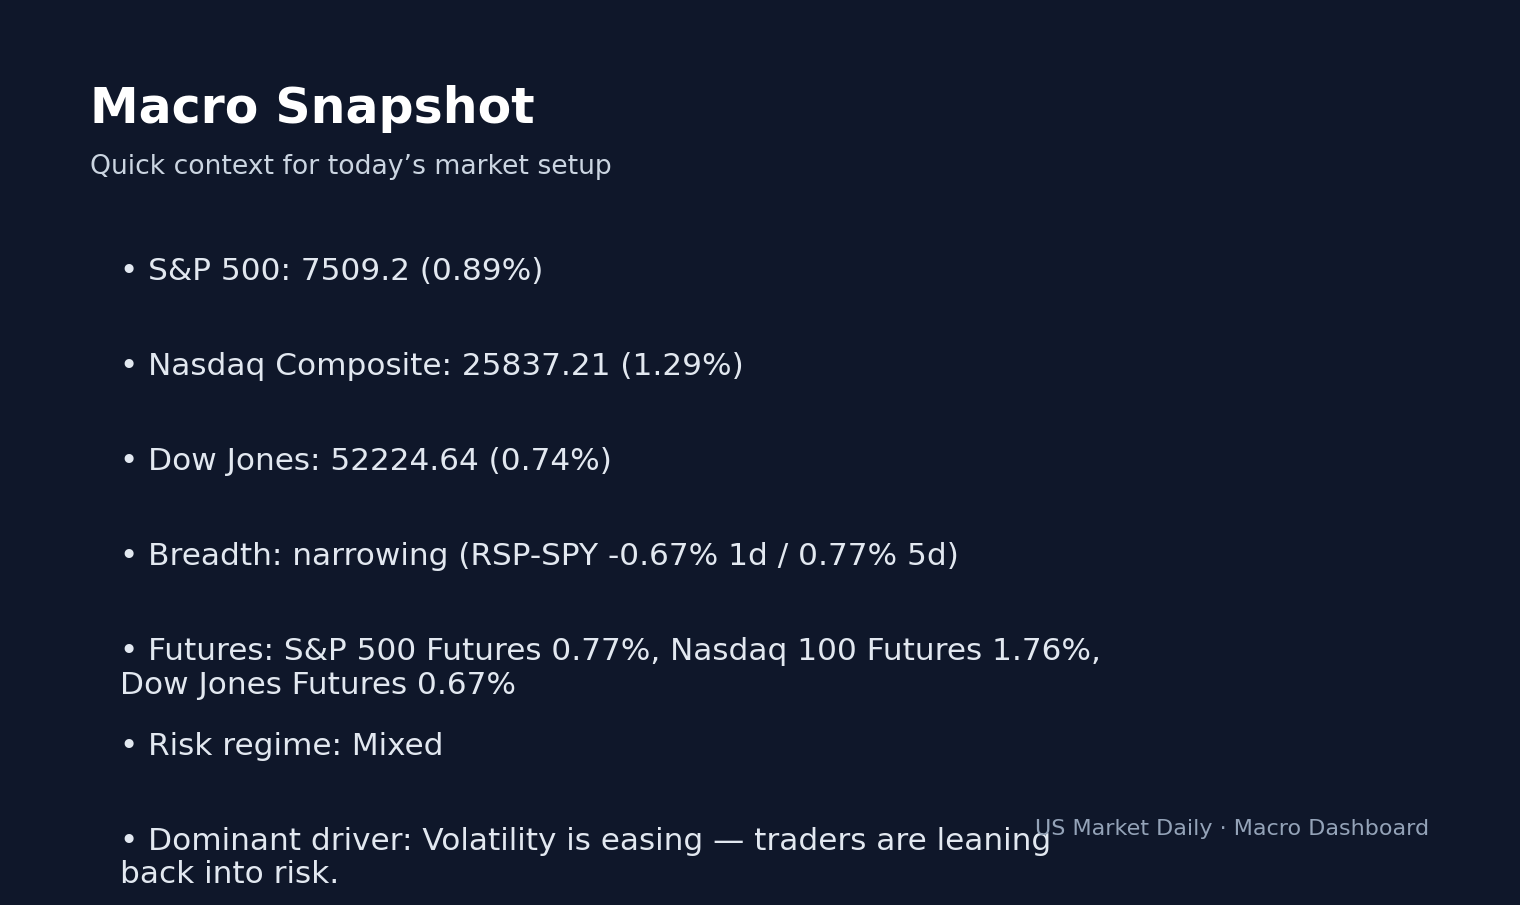
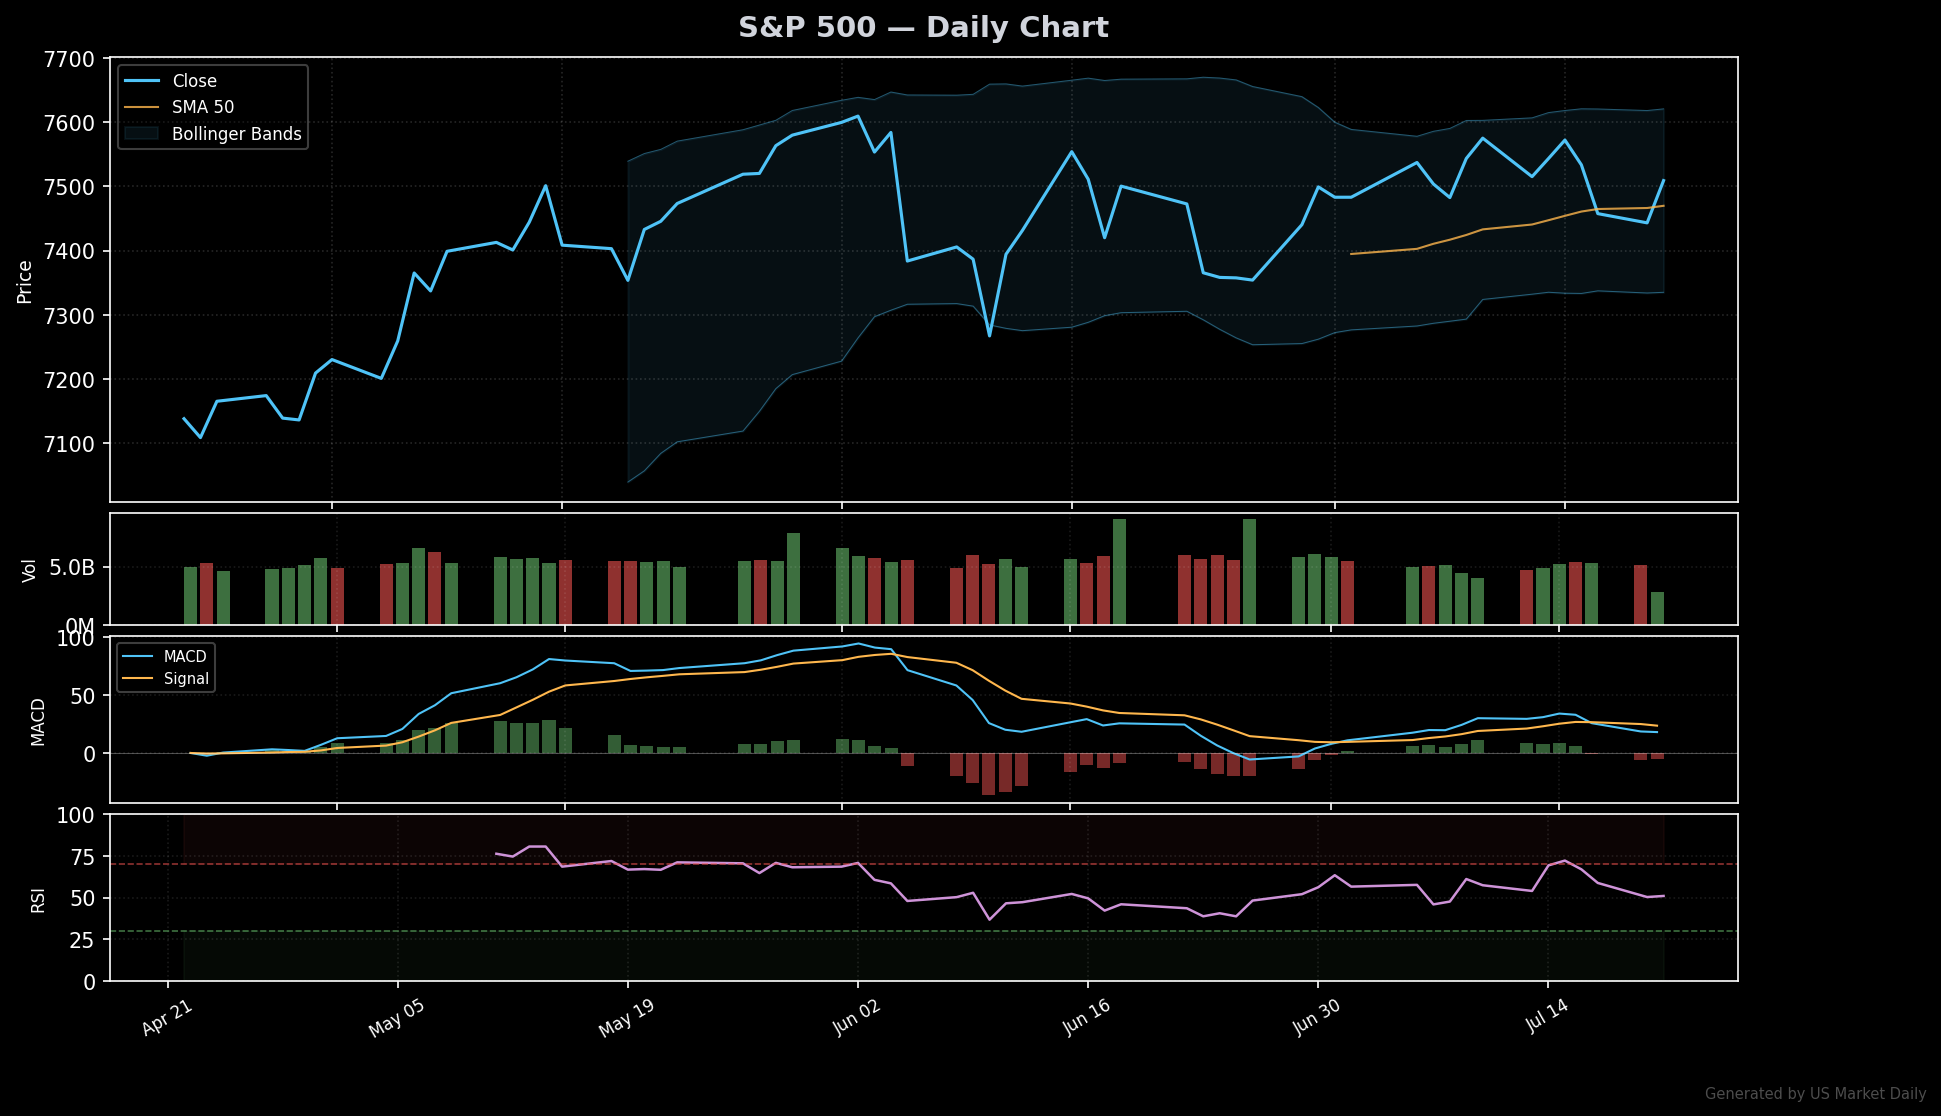
What stands out here is the asymmetry. HY spreads do not need to tighten much from 269 bps to keep equities supported; they simply need to avoid moving toward the 346.0 bps end of the 52-week range, per the pre-analyzed signal data. When credit starts from the 4th percentile, the upside contribution from tighter spreads is limited, but the downside signal from widening is large. That matters more with SPX spot at 7509.2 and SPX put/call open interest at 0.67, a call-heavy position set-up, per yfinance / CBOE-listed options data.
The cross-asset bridge is confirming, not contradicting, the credit message. VIX is 17.05, VIX3M is 19.59, VIX9D is 15.48, and the VIX term spread is +2.54, a mild contango regime, per yfinance / CBOE-listed options data. Tight HY spreads plus upward-sloping volatility means credit and options are both pricing orderly risk, not panic. That does not mean equities are cheap. It means macro risk is not yet forcing de-risking.
The tape is telling us that dips inside the SPX near-term implied move of ±1.42% over seven days are positioning events unless credit confirms stress, per yfinance / CBOE-listed options data. A move in HY OAS toward 346.0 bps would change that interpretation because it would shift the signal from volatility-only noise to balance-sheet repricing, per the pre-analyzed signal data.
+0.37% 10Y-2Y Spread Is a Young Steepening, Not a Free Pass
The 10Y-2Y spread is +0.37%, which makes the curve un-inverted, but it is still only in the 6th percentile of the last 52 weeks, per FRED Official data and the pre-analyzed signal data. That is a subtle but important point. The curve has repaired enough to stop flashing a classic inversion signal, but it has not steepened into a late-cycle boom reading. This is a young un-inversion.
The four-week move matters because the 10Y-2Y spread is rising by +0.100 over that period, while the 52-week range runs from +0.27% to +0.74%, per the pre-analyzed signal data. A rising positive curve supports the expansion call because it eases the pressure that an inverted curve puts on lenders, duration assets, and cyclical credit. But the data set does not provide the separate 10Y and 2Y yields, so the steepening cannot be split between falling front-end yields and rising long-end yields.
That missing split is not academic. If the curve is steepening because the front end is falling, the market is has at times reading easier policy ahead. If the curve is steepening because the long end is rising, the market is has at times demanding inflation or term premium compensation. The supplied data gives the spread, not the components, so the right interpretation is to read the curve beside Core PCE, CPI, M2, and the Fed rate.
On that score, the curve is supportive but not euphoric. The Fed target range is 3.50% to 3.75%, the effective fed funds rate is 3.63%, and the six-month rate direction is HOLD, per FRED Official data. Core PCE is 3.4% and at the 100th percentile of the last 52 weeks, per the pre-analyzed signal data. The curve says recession pressure has faded; inflation says the Fed has less room to validate every equity rally with easier policy.
208,000 Initial Claims Keep the Fed Patient
Initial claims are 208,000, in the 12th percentile of the last 52 weeks, and the four-week trend is falling by 22,000, per the pre-analyzed signal data. That is not a labor-market crack. It is a tight labor input that supports payroll income, consumer spending capacity, and cyclical revenue assumptions.
The BLS direct data adds scale: nonfarm payrolls stood at 158,984K in June 2026, per BLS direct data. Pair that with 208,000 initial claims and the expansion label has real support. This is not an equity market running on hope while the labor market deteriorates. The labor side is still supplying the income channel that lets revenue estimates survive.
The cost is policy patience. A tight labor market and 3.4% Core PCE leave the Fed with little reason to rush away from a 3.63% effective funds rate, per FRED Official data and the pre-analyzed signal data. That keeps the expansion regime intact but caps the argument for long-duration defensives. The sector playbook underweights TLT for this exact reason: if growth is firm and inflation is sticky, long bonds do not get a clean disinflation tailwind, per the supplied expansion sector playbook.
There is a second-order read for small-cap traders. Tight claims support cyclical demand, but the 30-year mortgage rate at 6.55% sits in the 76th percentile of the last 52 weeks, per the signal dashboard. That rate level keeps housing-sensitive balance sheets under pressure even while broader labor data looks expansionary. The regime is risk-on, but it is not a free pass for every refinancing-dependent business model.
3.4% Core PCE and 45 Sentiment Define the Scar Tissue
Inflation is the part of the dashboard that prevents a clean victory lap. Core PCE YoY is 3.4%, at the 100th percentile of the last 52 weeks, and the four-week trend is rising by +0.093, per the pre-analyzed signal data. CPI YoY is 3.7%, in the 83rd percentile, while CPI All Items was 333.952 in June 2026, according to BLS direct data and the signal dashboard. PPI Final Demand was 154.196 in June 2026, per BLS direct data.
The inflation mix matters because it changes who benefits from expansion. In a clean disinflationary expansion, duration and cyclicals can rally together. In this version, growth is present, but inflation is still high enough to keep the Fed on hold. That is why the expansion call favors XLK, XLY, XLI, and XLB over XLU, XLP, and TLT, per the supplied expansion sector playbook, but it does not justify indiscriminate risk.
The overlooked read-through is the gap between nominal liquidity and household mood. M2 growth YoY is 5.6%, at the 100th percentile of the last 52 weeks and rising, while consumer sentiment is 45, at the 0th percentile and falling by 8.1 over four weeks, per the signal dashboard and pre-analyzed signal data. That combination says liquidity is not scarce, but confidence is damaged. It is a market that rewards earnings durability and pricing control more than raw consumer optimism.
Where consensus is wrong is treating expansion as a single trade. The data says expansion is the regime, not the quality score. A Bloomberg-headline-only read sees tight credit and buys cyclicals. The fuller read sees tight credit, rising M2, sticky Core PCE, weak sentiment, and a 6.55% mortgage rate, then asks which companies can convert nominal demand into margin. Stock-level revenue, margin, valuation, and estimate data are not included in the supplied dataset, so the single-name conclusion cannot be stretched beyond a watchlist framework.
CFTC 2026-07-14 Shows Real Money Long ES and Hedge Funds Short NQ
Positioning is not neutral. In E-Mini S&P 500 futures, institutional asset managers were net long +940,472 contracts, while leveraged money was net short -365,002 contracts, per the CFTC Commitment of Traders report dated 2026-07-14. In NASDAQ-100 futures, institutions were net long +74,922 contracts and hedge funds were net short -80,323 contracts, per the same CFTC COT data.
That split is important because it tells us who is carrying the rally risk. Real money is structurally long, while hedge funds are leaning short. If credit stays tight at 269 bps and claims stay low at 208,000, hedge fund shorts remain a source of buying pressure because the macro data does not validate their bearish stance, per CFTC COT and the pre-analyzed signal data. If HY OAS starts moving toward 346.0 bps, the same positioning becomes fragile because the real-money long base has less room for surprise.
Options are consistent with the contested advance. SPX spot is 7509.2, the 30-day options-implied move is ±3.21%, the seven-day implied move is ±1.42%, and the SPX put/call open interest ratio for the next three monthlies is 0.67, per yfinance / CBOE-listed options data. QQQ spot is 708.97 with a 30-day implied move of ±5.60%, per the same options data. The market is paying more for QQQ amplitude than SPX amplitude, which fits an expansion regime led by growth and technology exposure.
The disconnect is that call-heavy SPX open interest and hedge fund short futures can coexist. That is not pure complacency. It is a market with real-money allocation, upside option demand, and fast-money skepticism all sitting on top of tight credit. This is why HY OAS is the cleaner arbiter than daily index noise. Credit widening would settle the argument against the bulls; stable 269 bps OAS keeps the expansion case intact, per the pre-analyzed signal data.
2024 Q4-2025 Q1 Analog: Same Curve Repair, Different Inflation Burden
The closest historical analog supplied is 2024 Q4 to 2025 Q1, the post-inversion soft-landing phase. In that period, SPY returned +12.1% over six months and TLT returned +0.8% over six months, while sector winners were Technology, Financials, and Industrials and losers were Utilities and REITs, per the supplied historical analog data. The note attached to that analog says the yield curve un-inverted from deeply negative, equities re-rated as the soft-landing narrative held, and credit spreads remained near historic tights, per the same analog data.
The similarity is obvious: today also has an un-inverted curve at +0.37% and benign HY spreads at 269 bps, per FRED Official data and the pre-analyzed signal data. The soft-landing analogy works because the market is seeing enough growth to keep equities supported and enough credit calm to avoid recession pricing. That is the exact combination that gave SPY a +12.1% six-month result in the analog period, per the supplied historical analog data.
The difference today is inside the inflation and sentiment columns. Core PCE is 3.4% and at the 100th percentile of the last 52 weeks, CPI YoY is 3.7% and in the 83rd percentile, M2 growth is 5.6% and at the 100th percentile, and consumer sentiment is 45 at the 0th percentile, per the signal dashboard. The analog data supplied does not provide matching Core PCE, M2, or sentiment levels for 2024 Q4 to 2025 Q1, so the clean comparison is structural: both periods have curve repair and tight credit, but today has a more visible tension between nominal liquidity and household confidence.
Worth noting: the analog says Financials were winners, but the current expansion sector playbook supplied here overweights XLK, XLY, XLI, and XLB; it does not include XLF, per the supplied sector playbook and historical analog data. I am not adding XLF to the current playbook without a current bank-specific signal, deposit-cost signal, or loan-growth signal. The analog is a guide to market behavior, not permission to import every old winner into the present setup.
XLK, XLY, XLI, XLB Carry the Expansion Playbook
The expansion playbook is clear at the ETF level: overweight XLK, XLY, XLI, and XLB; underweight XLU, XLP, and TLT, per the supplied expansion sector playbook. The stated rationale is that growth and cyclical sectors outperform in a risk-on regime, while rate-sensitive defensives lag, per the same sector playbook. The historical alpha line is also explicit: XLK plus XLY versus XLP has averaged +12% alpha over six months in expansion regimes, per the supplied expansion sector playbook.
That positioning fits this week because the dashboard is not defensive. HY OAS at 269 bps is tight, initial claims at 208,000 are low, the 10Y-2Y spread is positive at +0.37%, and M2 growth is 5.6%, per the pre-analyzed signal data and FRED Official data. Those inputs support cyclical earnings assumptions and growth multiples better than they support utilities, staples, or long bonds.
The caveat is that XLY needs selectivity. Consumer sentiment at 45 and the 30-year mortgage rate at 6.55% both argue against pretending that every household-facing business has the same demand quality, per the signal dashboard. The macro regime supports discretionary as a sector factor, but the consumer data says price-point, balance-sheet sensitivity, and financing dependence matter. That company-level sorting requires data not supplied here.
For single-stock readers, the supplied dataset does not include revenue, margin, valuation, estimate revisions, or price data for NVDA or CAT, so no stock-level edge is assigned. Those tickers belong on watchlists only after company-specific data is added. The regime evidence supports the ETF sleeve first: XLK for technology, XLY for discretionary, XLI for industrials, and XLB for materials, per the supplied expansion sector playbook.
TLT remains the clean underweight because the data does not give long bonds a strong catalyst. The Fed effective rate is 3.63% with a HOLD six-month trend, Core PCE is 3.4% and rising, and the 2024 Q4 to 2025 Q1 analog showed TLT returning only +0.8% over six months, per FRED Official data, the pre-analyzed signal data, and the supplied historical analog. Long bonds can rally in a growth scare. This dashboard is not a growth scare.
90-Day Bull / Base / Bear Around SPX 7509.2
The next 90 days should be framed around three levels: SPX spot at 7509.2, HY OAS at 269 bps, and Core PCE at 3.4%, per yfinance / CBOE-listed options data and the pre-analyzed signal data. The market is already pricing a ±3.21% SPX move over the next 30-day expiry and a ±5.60% QQQ move over the next 30 days, per yfinance / CBOE-listed options data. That gives the scenario map a volatility boundary without inventing unsupported index targets.
Bull: HY OAS Holds 263.0-269 bps and QQQ Carries the Risk-On Trade
The bull case is that HY OAS stays near the tight end of its 263.0 to 346.0 bps 52-week range, initial claims remain anchored around 208,000, and the 10Y-2Y spread stays positive around +0.37%, per the pre-analyzed signal data. In that case, SPX can trade through the upper side of its supplied ±3.21% 30-day implied move from 7509.2 during the next 90 days, while QQQ remains the higher-beta expression because its supplied 30-day implied move is ±5.60%, per yfinance / CBOE-listed options data. The sector implication stays XLK, XLY, XLI, and XLB over XLU, XLP, and TLT, per the supplied expansion sector playbook.
Base: SPX 7509.2 Chops Inside ±3.21% While the Fed Holds 3.63%
The base case is expansion without policy relief. HY OAS stays stable around 269 bps, the curve remains positive, claims stay low, and Core PCE remains the irritant at 3.4%, per FRED Official data and the pre-analyzed signal data. In this path, SPX works around 7509.2 inside the supplied ±3.21% 30-day options band, and QQQ retains wider swings inside its supplied ±5.60% 30-day band, per yfinance / CBOE-listed options data. This is not a bearish base case. It is a risk-on tape with less upside asymmetry than the headline expansion label implies.
Bear: HY OAS Moves Toward 346.0 bps and Claims Move Toward 259,000
The bear case begins when credit and labor stop confirming expansion. HY OAS moving toward the 346.0 bps top of its 52-week range, initial claims moving toward the 259,000 top of their 52-week range, or the 10Y-2Y spread falling back toward the 0.27% low of its 52-week range would weaken the current regime, per the pre-analyzed signal data. In that path, SPX tests the lower side of its supplied ±3.21% 30-day implied move from 7509.2, and call-heavy positioning at a 0.67 SPX put/call open interest ratio becomes a vulnerability rather than fuel, per yfinance / CBOE-listed options data.
The risk/reward is therefore not symmetric. The bull case needs stability more than improvement: credit can stay tight, labor can stay firm, and growth sectors can keep leading. The bear case only needs one of the current pillars to slip because credit is already near the tight end, sentiment is already at 45, and Core PCE is already at the 100th percentile, per the signal dashboard. Expansion is the right label, but the regime has little tolerance for inflation re-acceleration alongside credit widening.
What to Watch: HY OAS at 269 bps Versus Core PCE at 3.4%
- Watch whether HY OAS stays near 269 bps while Core PCE YoY is 3.4% and rising, per the pre-analyzed signal data.
- Key level: 346.0 bps, the 52-week high for HY OAS in the supplied range, because a move toward that level would move credit out of benign expansion pricing, per the pre-analyzed signal data.
- If initial claims hold near 208,000 and the 10Y-2Y spread stays positive at +0.37% then XLK, XLY, XLI, and XLB keep the cleaner regime support versus XLU, XLP, and TLT, per FRED Official data and the supplied expansion sector playbook.
- Trigger: Next BLS inflation and labor releases after the June 2026 CPI, PPI, and payroll prints; exact release dates and times were not provided in the supplied dataset, per BLS direct data.
Next-session watchpoint: Confirmation comes if breadth stays firm and volatility stops expanding; invalidation comes if leadership narrows while the VIX pushes higher.
Market Snapshot — Verifiable Reference Data
The following ETF and benchmark prices are sourced from public market data and serve as the reference points for the analysis above. All values reflect the latest available close.
| Ticker | Description | Price | Change |
|---|---|---|---|
| SPY | SPDR S&P 500 | $748.28 | +0.83% |
| QQQ | Invesco QQQ (Nasdaq) | $708.97 | +1.85% |
| TLT | iShares 20+ Treasury Bond | $83.66 | -0.27% |
| GLD | SPDR Gold | $374.81 | +1.96% |
| UUP | Invesco DB USD (DXY) | $28.48 | +0.32% |
Primary Sources & Further Research
This analysis is based on publicly available primary data. According to FRED — HY Spreads (BAMLH0A0HYM2), the underlying data series provide the most authoritative measurement for verification. Cross-reference with FRED — VIX (VIXCLS) and FRED — Fed Funds Rate (DFF) is recommended before acting on any single signal. The full source list below covers the dataset used in this analysis.
- FRED — HY Spreads (BAMLH0A0HYM2)
- FRED — VIX (VIXCLS)
- FRED — Fed Funds Rate (DFF)
- FRED — 10-Year Treasury (DGS10)
- BLS — Employment Situation
- Fed FOMC Calendar
Reading the actual filing text or official data series — not just summaries — provides the most accurate picture for any analytical position.
Editor’s Insight — Jungwook Shin, Small-Cap Equity Analyst
The framework I work with: macro data sets the baseline probability for any thesis. A tight HY spread regime makes positive single-stock catalysts produce larger up-moves; a widening regime mutes them. This isn’t predictive — it’s positioning. Read the macro tape first, then size individual positions accordingly.
Reviewed by analyst before publication. Analysis based on publicly available primary sources.
Frequently Asked Questions
What macro regime is the US market in for the week of July 22, 2026?
The regime is EXPANSION. The call is supported by a +0.37% 10Y-2Y spread, 269 bps HY OAS, and 208,000 initial claims, per FRED Official data and the pre-analyzed signal data.
Why are HY credit spreads important for stocks right now?
HY OAS is 269 bps, in the 4th percentile of the last 52 weeks, per the pre-analyzed signal data. That means credit is not pricing recession stress, but the 346.0 bps 52-week high is the level that would challenge the expansion call.
Which sectors fit the expansion regime?
The supplied expansion sector playbook overweights XLK, XLY, XLI, and XLB while underweighting XLU, XLP, and TLT. It also shows XLK plus XLY versus XLP has averaged +12% alpha over six months in expansion regimes.
What is the biggest risk to the expansion call?
The main risk is inflation persistence rather than current labor weakness. Core PCE YoY is 3.4% at the 100th percentile and rising, while consumer sentiment is 45 at the 0th percentile, per the signal dashboard.
What do SPX and QQQ options imply now?
SPX spot is 7509.2 with a supplied ±3.21% implied move over the next 30-day expiry and ±1.42% over seven days, per yfinance / CBOE-listed options data. QQQ spot is 708.97 with a supplied ±5.60% implied move over the next 30 days.
- Top Dividend Stocks with 4%+ Yield — May 2026: 7 Names to Watch
- German GDP Growth Forecast Cut to 0.5% on Apr 16, 2026: Global Impact
- AMD +5.5%: 2 Profitable Stocks for Long-Term Investors and 1 Facing Headwinds —
- What Is SMA 200 in Stocks? Complete 2026 Guide with Examples
- Why Is VEEE Stock Up 62%? Acquisition News
Explore the Macro & Risk Regime Playbook
This article fits into our Macro & Risk Regime topic cluster and is meant to serve what happened.
Evergreen angles to build next
- How Macro Headlines Spill Into Stocks — Connect rates, dollar, oil, and risk sentiment to single-stock reactions without overfitting the headline.
- How to Read Post-Spike Risk — Frame the second-day risk after a sharp move instead of blindly extrapolating the first headline bar.
- How to Use Support/Resistance After a Gap — Turn gap levels, failed breakouts, and reclaim zones into a cleaner post-news playbook.
Cluster-adjacent reads
Macro Risk Regime Playbook
A hub for reading how the dollar, oil, credit, and safe-haven flows reshape equity risk.
Suggested reading path
- Start with risk-on vs risk-off
- Then connect dollar/oil/credit moves
- Use daily event notes to see regime shifts as they happen
Core evergreen guides in this hub
- How Macro Headlines Spill Into Stocks — Connect rates, dollar, oil, and risk sentiment to single-stock reactions without overfitting the headline.
- How to Read Post-Spike Risk — Frame the second-day risk after a sharp move instead of blindly extrapolating the first headline bar.
- How to Use Support/Resistance After a Gap — Turn gap levels, failed breakouts, and reclaim zones into a cleaner post-news playbook.
- What Makes a Short Squeeze Durable — Explain when a squeeze has real staying power versus when it is just a one-session liquidity event.
Glossary anchors: risk-off, credit spreads, cross-asset, safe haven
Market context: Open the Fed Watch for the latest verified dashboard data.
This analysis is provided for educational and informational purposes only. It is not investment advice. Consult a qualified financial advisor before acting on any information presented here.