10:03 AM ET on July 21, 2026: the Nasdaq Composite is up 0.88% at 25,731.78, outpacing the S&P 500’s 0.50% rise to 7,480.78 as Technology leads the tape with a 1.97% sector gain, per Market Data.
The immediate market message is clear but incomplete: risk appetite is improving through growth and semiconductors, while VIX is down 3.65% to 17.97, per Market Data. The driver supplied for this alert is a trending financial news headline labeled as a high-priority market event, but the specific headline details were not included in the event feed, so the alert should be read as a price-action translation rather than a confirmed catalyst analysis.
The key risk at 10:03 AM ET is that traders mistake the first knee-jerk move for the full-market message before liquidity and confirmation arrive. With the S&P 500 only 11.46 points above its 50-day moving average of 7,469.32 and RSI(14) at 48.17, today’s nearest actionable level is not an upside target; it is the 7,469.32 support line that separates a constructive opening bid from a failed bounce, per Market Data.
What Changed at 10:03 AM ET on July 21?
At 10:03 AM ET, the market alert shows a risk-on open led by Nasdaq strength, not a broad all-clear signal. The Nasdaq 100 futures gain of 1.33% to 29,160.75 is stronger than S&P 500 futures at +0.35% and Dow futures at +0.09%, per Market Data, which means the bid is concentrated in duration-sensitive growth and large-cap technology rather than evenly distributed across the market.
What stands out here is the split between index strength and sector selectivity. Technology is up 1.97%, while Communication is down 0.47% and Consumer Staples are down 0.76%, per Market Data. That is not classic defensive buying. It is a rotation toward earnings and AI-linked beta, with investors accepting equity risk while still refusing to pay for every sector equally.
The first-order consequence is straightforward: a Technology-led Nasdaq move can pull the S&P 500 higher even when the rest of the market is more cautious. That matters because the S&P 500 at 7,480.78 is only slightly above its 50-day moving average of 7,469.32, per Market Data. A market alert built on tech leadership becomes more credible if that level holds through the first hour and less credible if the index slips back below it.
There is no supplied official release time, agency statement, Fed comment, CPI print, earnings call, or SEC filing tied to the broad market move. That absence matters. Without a named catalyst in the event feed, traders should treat the headline as a high-priority signal that needs confirmation from breadth, yields, and volatility rather than as a fully explained repricing.
Why Are Stocks Moving on July 21 With VIX at 17.97?
Stocks are moving higher because growth leadership is outweighing defensive weakness: the Nasdaq Composite is up 0.88%, the S&P 500 is up 0.50%, and VIX is down 3.65% to 17.97, per Market Data. The move says traders are reducing near-term hedges while chasing Technology exposure.
The cross-asset bridge is less clean than the equity screen suggests. The 10-year Treasury yield is listed at 4.64%, up 0.83% on the session, per Market Data, while the FRED macro snapshot shows the latest 10-year yield at 4.55% as of July 17 after a 5-day decline of 7 basis points. Higher yields usually pressure long-duration growth stocks, so Nasdaq outperformance alongside a firmer 10-year tells us the equity bid is being driven by earnings momentum, positioning, or headline urgency rather than a simple rates-relief trade.
That is the strategist’s read: the tape is telling us buyers are willing to pay for growth even before the bond market gives them a clean green light. In a sticky-inflation regime, with CPI YoY at 3.7% and the Fed Funds Rate at 3.63% as of June 1, per FRED data, that is an upside constraint. The market can rally, but it has less room for valuation expansion if rate-cut expectations remain delayed.
VIX at 17.97 also needs context. It is below the FRED snapshot’s VIX level of 18.6 and above the 20-day average of 17.1, per FRED data, which means volatility has cooled from the latest macro snapshot but has not returned to a low-stress regime. That is why this market alert should be read as an active trading signal, not a settled macro verdict.
S&P 500 at 7,480.78: Why 7,469.32 Matters
The S&P 500’s nearest actionable level is 7,469.32, the 50-day simple moving average, because the index is trading at 7,480.78 and remains only 11.46 points above that line, per Market Data. A hold above 7,469.32 keeps the opening bid intact; a break below it turns the market alert into a failed reclaim.
The technical picture is not stretched. RSI(14) is 48.17, which the supplied technicals classify as neutral, and the S&P 500 is inside its Bollinger Band, per Market Data. MACD is 16.4002 versus a signal line of 24.0413 with no crossover, which means momentum has not delivered a clean upside confirmation.
The overlooked signal is that today’s index level is close enough to the 50-day average that small flows can change the character of the session. If the S&P 500 holds 7,469.32 while Technology remains near +1.97%, the market can keep treating the alert as a growth-led continuation. If the index loses 7,469.32 while VIX reverses higher from 17.97, the same headline becomes a liquidity test.
This is where the risk of over-reading the first move is highest. A 0.50% S&P 500 gain looks clean on the headline tape, but the index is not far enough above its nearest technical line to call the move durable. Traders need confirmation from breadth and from the 10-year yield; they do not have a full confirmation set from the supplied data.
Which Stocks Are Driving the July 21 Market Alert?
The single-stock board shows the strongest upside concentrated in deal, contract, hardware, and high-beta technology names. UTZ is up 88.99% to $14.07 after Germany’s Intersnack agreed to buy Utz in a $2.9 billion deal, per the supplied Market Data source. CRNT is up 7.55% to $2.28 after Ceragon secured a $70 million APAC mobile network contract, per the supplied SEC filing source.
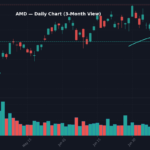
Beyond those named catalysts, the technology and hardware tape is broad. WDC is up 10.45% to $538.34, STX is up 8.92% to $874.00, MU is up 7.62% to $931.39, AMD is up 4.82% to $527.86, TSM is up 3.33% to $415.71, and NVDA is up 1.04% to $205.38, per Market Data. That clustering matters because it points to demand for compute, memory, storage, and semiconductor exposure rather than a one-stock squeeze.
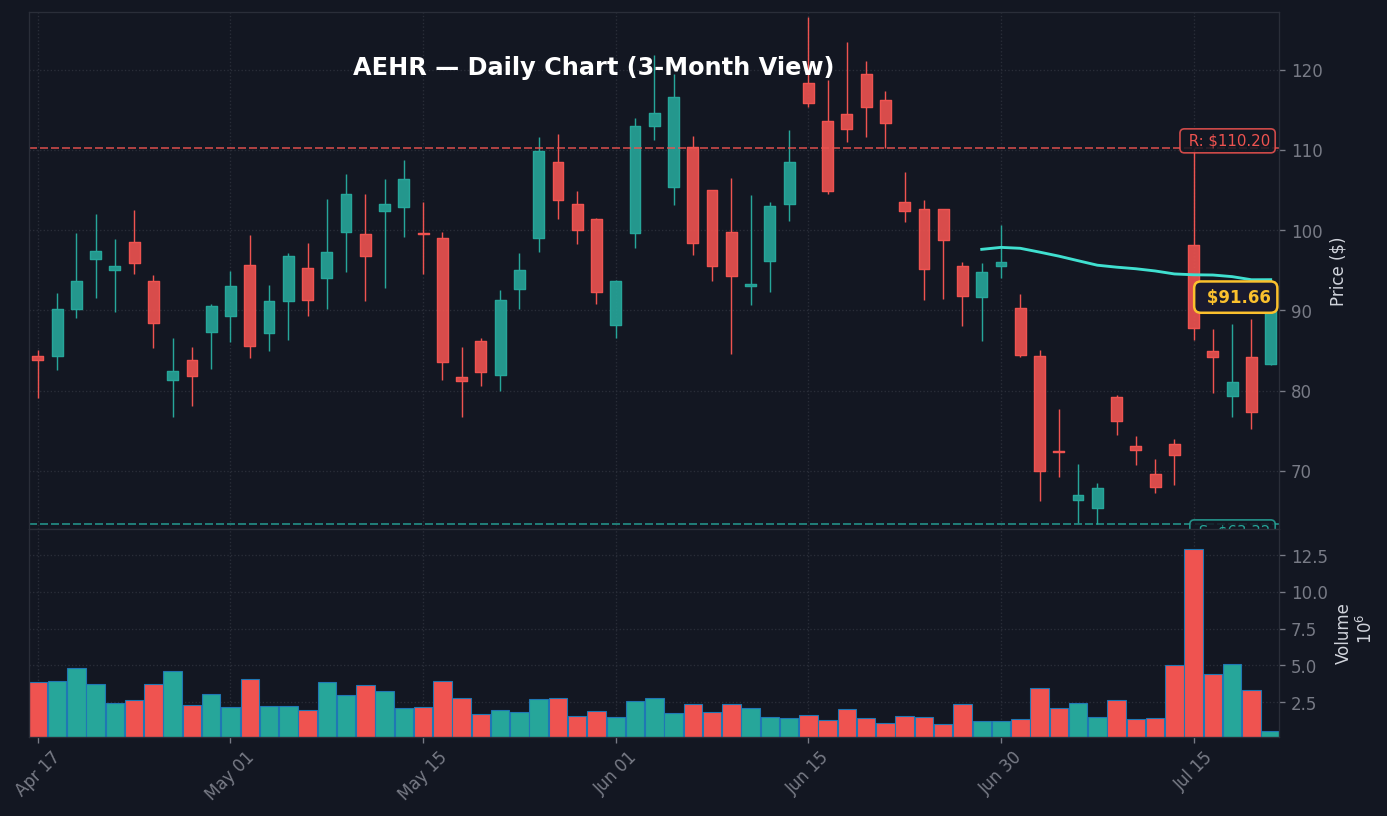
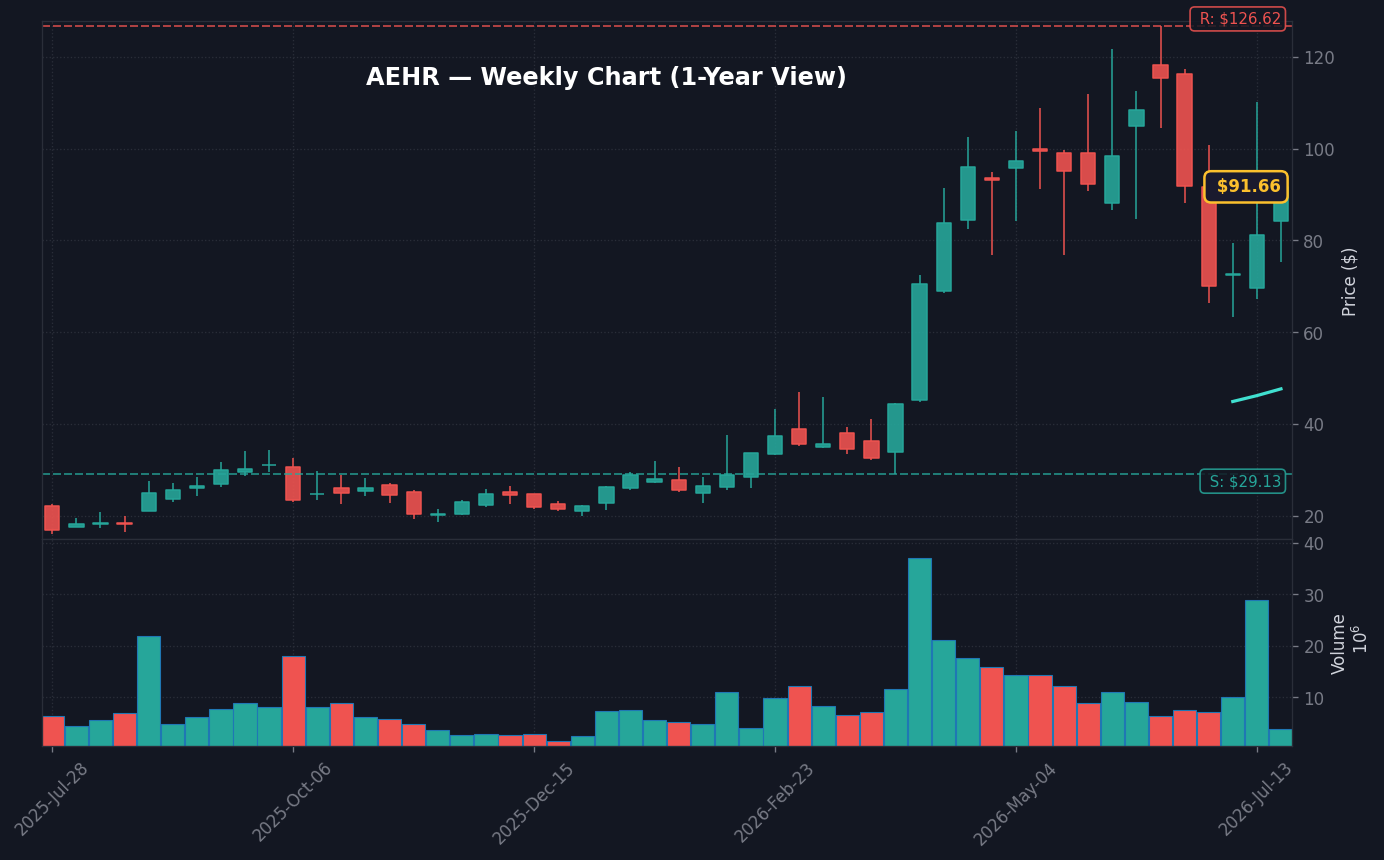
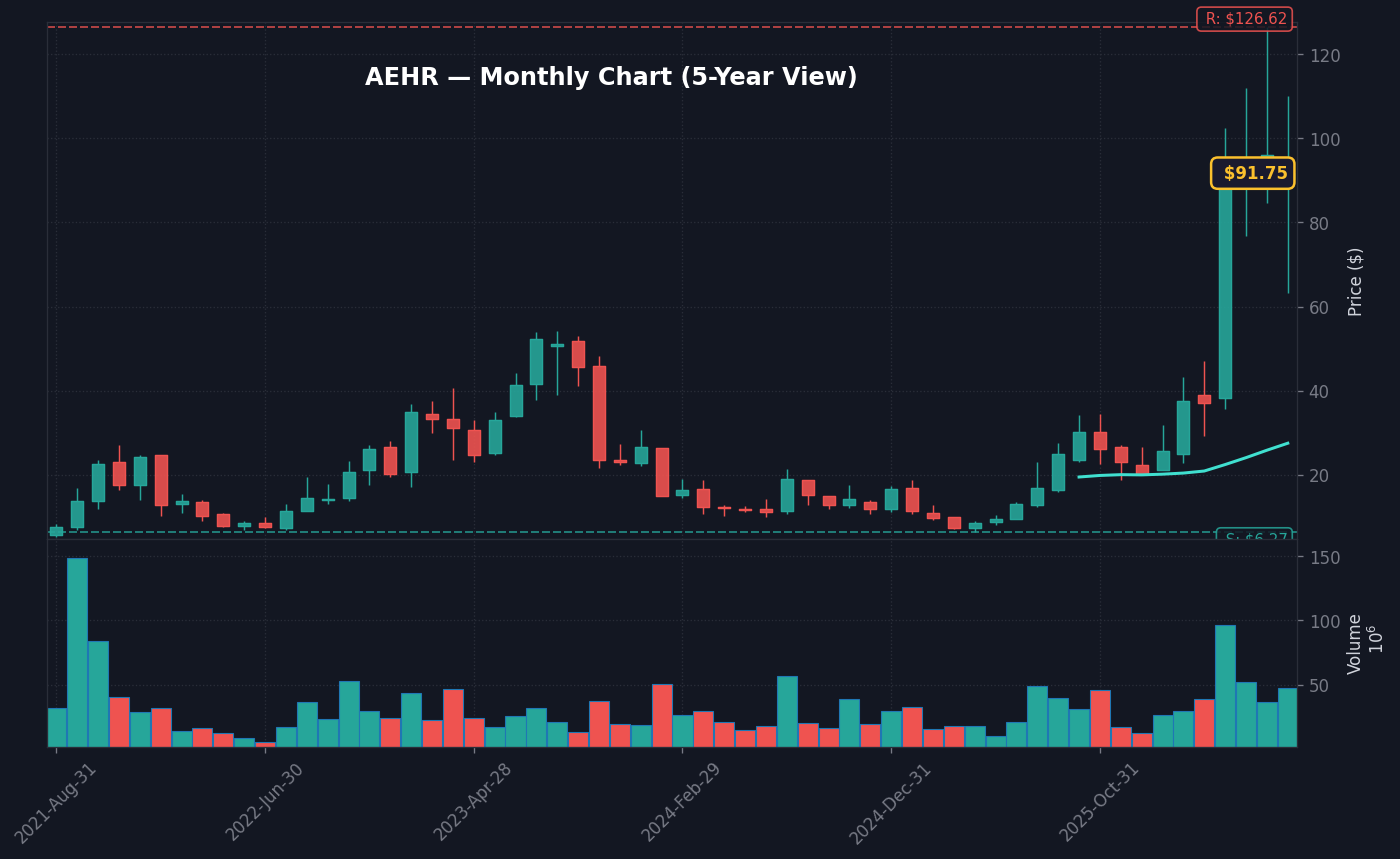
Worth noting: the market alert is not only about mega-cap tech. AEHR is up 20.57% to $93.31, BE is up 11.17% to $219.07, DOCN is up 10.26% to $131.29, COIN is up 9.73% to $176.03, TER is up 9.82% to $366.53, and OUST is up 9.61% to $38.11, per Market Data. That is a high-beta tape, and high-beta rallies require liquidity support to last beyond the first hour.
The loser board shows why the broader market message is not one-way. DHR is down 12.75% to $175.47, MSCI is down 10.86% to $557.24, VICR is down 8.94% to $210.33, CALX is down 9.31% to $34.78, and HAL is down 6.41% to $32.86, per Market Data. When high-beta technology rises while select quality, data, industrial, and energy-linked names fall, the tape is rewarding specific catalysts and factor exposure rather than lifting everything indiscriminately.
What Is Known at 10:03 AM ET, and What Is Missing?
Known: the S&P 500 is up 0.50%, the Nasdaq Composite is up 0.88%, the Dow is up 0.37%, and VIX is down 3.65%, per Market Data. Known: Technology is the strongest sector at +1.97%, while Consumer Staples are the weakest at -0.76%, per Market Data. Known: the S&P 500 is above its 50-day moving average of 7,469.32, but only by 11.46 points.
Missing: the event feed did not provide a specific breaking headline, official statement, timestamped release, or named speaker behind the high-priority market alert. Missing: there is no supplied market breadth figure, volume ratio, options skew, high-yield OAS, MOVE index reading, or intraday dollar move. Those gaps matter because the first 30 to 60 minutes after a breaking headline often price liquidity first and information second.
The disconnect is that the tape is behaving as if it has a growth-positive catalyst, but the supplied event record does not identify the catalyst. That does not invalidate the move. It does mean the cleanest trade read is conditional: Technology leadership plus a hold above 7,469.32 supports the bullish interpretation; a break of 7,469.32 would argue the first move was more positioning than conviction.
The macro backdrop argues for discipline. Fed Funds at 3.63%, CPI YoY at 3.7%, unemployment at 4.2%, and a 10Y-2Y spread of 0.37 percentage points all come from the FRED snapshot. Sticky inflation constrains the upside thesis because delayed cuts reduce the market’s ability to re-rate expensive growth purely on lower discount rates.
3 Scenarios for SPY Proxy Risk Around 7,469.32
3 Scenarios From Here
- Bull: S&P 500 holds 7,469.32 through the next confirmation window and Technology stays near +1.97% → the index can press back above 7,510.25 futures as the opening bid broadens.
- Base: S&P 500 chops between 7,469.32 and 7,510.25 while VIX stays near 17.97 → the alert remains a tradable growth-led move, not a full-market breakout.
- Bear: S&P 500 loses 7,469.32 while VIX reverses from 17.97 toward the FRED snapshot level of 18.6 → downside risk shifts back toward a failed 50-day reclaim.
Counterintuitively, the bull case is not simply “Nasdaq up more.” The better bull case is breadth improvement underneath the Nasdaq move: Financials moving off 0.00%, Communication recovering from -0.47%, and Consumer Staples no longer sitting at -0.76%, all per Market Data. That would show the alert is pulling capital into the market, not just concentrating it in one crowded factor.
The bear case is also not a crash call. It is a failure-of-confirmation call. If the S&P 500 breaks 7,469.32 while the 10-year yield stays near 4.64%, per Market Data, the market would be telling us that higher discount rates still matter once the first headline chase fades.
What the Tape Is Not Pricing Yet on July 21
What the tape is not pricing yet is the possibility that sticky inflation turns a growth-led rally into a narrower, more fragile market. CPI YoY is 3.7%, Fed Funds are 3.63%, and the 10-year Treasury is 4.55% in the latest FRED snapshot as of July 17, while current Market Data lists the 10-year at 4.64%. That combination does not give equity investors the easy-rate backdrop that powered earlier valuation expansions.
Consensus tends to treat lower VIX as permission to add risk. The more useful read today is conditional: VIX down 3.65% to 17.97 helps short-term risk appetite, but VIX still sits above the 20-day average of 17.1 in the FRED snapshot. A volatility index that is falling but not cheap can support intraday buying without confirming a multi-session risk reset.
This matters most for the crowded winners. NVDA at $205.38, AMD at $527.86, TSM at $415.71, MU at $931.39, WDC at $538.34, and STX at $874.00 are all tied to the same broad technology complex, per Market Data. If the bond market refuses to cooperate, the next trade may shift from “own tech beta” to “separate earnings catalysts from duration exposure.”
The market alert therefore has two layers. The surface layer is bullish: Nasdaq leadership, lower VIX, and a positive S&P 500. The deeper layer is less forgiving: the S&P 500 is only 11.46 points above its 50-day moving average, the 10-year yield is listed at 4.64%, and the catalyst details are missing from the event feed.
What to Watch: S&P 500 7,469.32 Hold
- Watch whether the S&P 500 stays above its 50-day moving average at 7,469.32 after the 10:03 AM ET market alert.
- Key level: 7,469.32, the S&P 500 50-day simple moving average, with the index at 7,480.78 per Market Data.
- If Technology holds near +1.97% and VIX remains near 17.97 then the Nasdaq-led bid can keep pulling the S&P 500 toward the 7,510.25 futures level.
- Trigger: Next confirmed update to the high-priority July 21, 2026 market alert headline; no official event time was supplied.
Frequently Asked Questions
Why did the Nasdaq rise on July 21, 2026?
The Nasdaq Composite rose 0.88% to 25,731.78 at 10:03 AM ET, led by a 1.97% gain in Technology, per Market Data. The supplied event feed labeled the move as a high-priority market alert but did not include the specific breaking headline.
What S&P 500 level matters after the July 21 market alert?
The key S&P 500 level is 7,469.32, the 50-day simple moving average, per Market Data. The index was at 7,480.78, only 11.46 points above that line, making it the nearest actionable support level.
How did bonds and volatility affect the July 21 stock move?
VIX fell 3.65% to 17.97, supporting the risk-on equity move, while the 10-year Treasury yield was listed at 4.64%, per Market Data. That combination means equities were buying growth exposure even though rates were not giving a clean easing signal.
Data sources: Yahoo Finance · SEC EDGAR · InvestorsHub · Just Food
The information presented here is for general informational purposes only and should not be considered as personalized investment advice. All investing involves risk.