🇺🇸 US Market CLOSED Thu, May 14 &0514am1604; 4:05 AM EDT
Data: SEC · EDGAR · FRED · Yahoo Finance

Ambiq Micro (AMBQ) +27% After Earnings Beat — Is the Upside Sustainable?

Updated: May 12, 2026 at 09:58 AM ET · Reading time: 4 min · Author expertise: Small-Cap Equity Analyst

Why trust us: We separate factual market inputs from interpretation and link our process below.

Methodology · Data sources · Editorial policy

AMBQAmbiq Micro, Inc.
$58.00▲ +27.00%

Technology · Semiconductors

Volume668K
Avg Volume385K
Market Cap$1.2B
CatalystAmbiq Micro (NYSE:AMBQ) Surges on Blowou

According to Yahoo Finance, Worth a closer look at Ambiq Micro (AMBQ) after today’s 27.0% surge—here is the read on the move and the technicals.

AMBQ shares spiked 27.0% today, driven by the company’s Q1 financial report, which saw revenues top analyst estimates despite a persistent net loss. The move stands out because it occurred during a session where the S&P 500 fell 0.55% and the tech-heavy XLK sector slid 1.42%, confirming the move is purely idiosyncratic and tied to company-specific strength rather than broader market momentum. Our comfort level with this catalyst is partial; while top-line growth is encouraging, the company’s negative operating margins—reported at -57.66%—mean the market is pricing in long-term AI potential over immediate profitability.

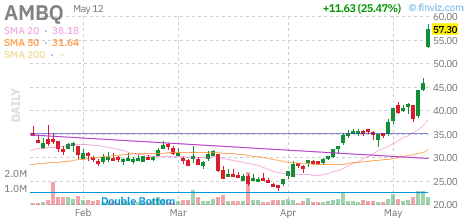
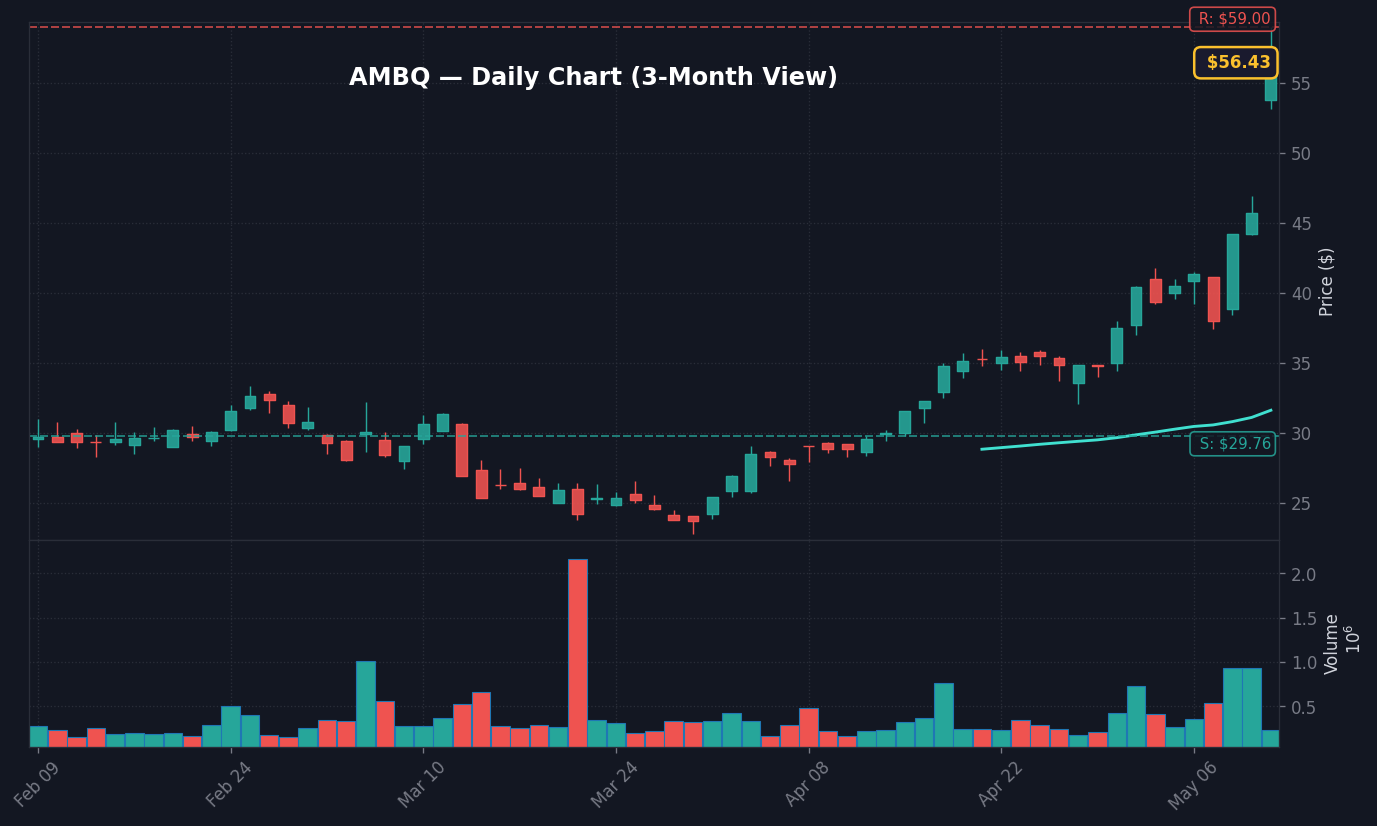
Investors should watch how the stock holds above its 20-day VWAP of $39.48, as the current RSI reading of 83.01 indicates overbought territory. What’s driving this is a clear decoupling from the macro environment; with a 1-year beta of 2.8, AMBQ’s alpha today of +28.54% is significant, suggesting institutional accumulation following the earnings print.

What This Company Does

Ambiq Micro, Inc. (AMBQ), headquartered in Austin, Texas, is a semiconductor firm that specializes in ultra-low-power microcontrollers and systems-on-chip (SoC). The company leverages its proprietary Subthreshold Power Optimized Technology (SPOT) platform to reduce power consumption in battery-powered edge AI applications, per Wikipedia. By targeting devices such as smartwatches, fitness trackers, and AR/VR glasses, the firm aims to enable real-time, on-device AI processing without the typical thermal or power constraints of traditional hardware.

Incorporated in 2010 and going public in 2025, the company maintains a unique niche within the semiconductor industry. With a market cap of approximately $1.22B, Ambiq operates in a competitive space, relying on its proprietary AI-acceleration and memory innovations to maintain its competitive moat. The company distributes its products through both a direct sales force and a global network of distributors.

Takeaway: Ambiq designs ultra-low-power semiconductor chips specifically optimized for edge AI and battery-efficient consumer devices.

Why It Moved Today

The 27.0% pop is directly tied to the company’s latest financial disclosure. According to the 8-K filed on 2026-05-12, the firm managed to beat revenue expectations despite broader headwinds in the semiconductor space. The story looks solid because the revenue beat implies growing demand for its edge AI solutions, which have historically been a difficult segment to monetize. However, the market seems to be overlooking the net loss of $25.8M as of the September 30, 2025, 10-Q filing, favoring the growth narrative instead.

The real story is the intensity of the buying volume. With 5.87% of the float held short, the move was likely exacerbated by a short squeeze. Per Zacks news, the reaction to these earnings shows that investors are willing to reward tech firms that demonstrate top-line expansion even when operating margins remain negative. This reflects a risk-on sentiment for specific sub-sectors of semiconductors, despite the broader market’s decline.

MetricValue
Trailing EPS-$4.57
Forward EPS-$1.17
Revenue (TTM)$72.51M
Revenue Growth2.00%
Gross Margin44.26%
Trailing P/EN/A
Ambiq Micro, Inc. (AMBQ) Reports Q1 Loss, Tops Revenue Estimates
Source: Zacks

Takeaway: The Q1 revenue beat is the primary catalyst, with high conviction that growth expectations are the main driver.

Chart Setup and Key Levels

AMBQ technical chart with RSI, MACD, Bollinger Bands
AMBQ daily chart with SMA 20/50/200 and volume — source: Finviz, May 12, 2026 · Chart: Finviz

Daily Chart

The daily chart for AMBQ shows a massive breakout above the 50-day SMA of $31.63. With an RSI at 83.01, the stock is technically overbought, which suggests the current pace of appreciation may meet profit-taking pressure in the immediate term. Resistance is anchored at the $59.00 level, which marks the 20-day high and the 60-day high.

AMBQ Daily Chart — 3-month view with SMA50/200

Weekly Chart

On a weekly timeframe, AMBQ is pushing through the upper Bollinger Band of $49.61. This confirms that the current momentum is significantly outside the statistical mean. We need to watch if the price can consolidate above the 20-day VWAP of $39.48 to validate the breakout as more than a short-lived squeeze.

AMBQ Weekly Chart — 1-year view with SMA50/200

Monthly Chart

The long-term monthly outlook is still developing given the company’s relatively recent public listing. Support at the $29.76 level, the 20-day low, is a crucial floor for bulls. If the stock breaks below this, the next major support zone is at $22.75, which is the 60-day low.

AMBQ Monthly Chart — 5-year view with SMA50/200
Takeaway: Key resistance is set at $59.00, while holding above $29.76 support is critical for maintaining current momentum.

Outlook and Watchpoints

The near-term outlook for AMBQ is one of high volatility as the market digests the earnings surprise. What would confirm this setup is a sustained daily close above the $49.61 upper Bollinger band, which would indicate strong underlying buying pressure. I would be looking for higher-than-average volume to accompany any move toward the $59.00 resistance level.

Conversely, what would invalidate this setup is a failure to hold the $29.76 support level. If the price re-enters the range between $22.75 and $29.76, the momentum from the earnings beat would likely have dissipated. I’d lean cautious until the stock shows a base-building period at current levels, given that the RSI is currently in the high 80s, suggesting the stock is extended relative to its recent average movement.

3 Scenarios From Here

  • Bull: Sustained trading volume keeps the price above $49.61 → target $59.00 near-term.
  • Base: Consolidation between $31.63 and $49.61 → likely over the next 1-2 weeks.
  • Bear: Close below $29.76 support → downside risk to $22.75.

Frequently Asked Questions

Why is AMBQ stock moving up today?

AMBQ shares rose 27.0% today primarily because the company reported Q1 financial results that exceeded analyst revenue expectations. This move is considered idiosyncratic, meaning it is driven by company-specific news rather than broad market or sector trends.

What is the key resistance level for Ambiq Micro?

The key resistance level for AMBQ is $59.00, which corresponds to both the 20-day high and the 60-day high. This level acts as a psychological and technical ceiling that the stock will need to clear to sustain its current momentum.

Data sources: Yahoo Finance · Zacks · GuruFocus.com


This article is for informational purposes only and does not constitute financial advice. Always do your own research before making investment decisions.

📊 Data Sources
yfinance · FRED (St. Louis Fed) · SEC EDGAR · Finnhub · World Bank · Wikidata
Last Updated: 2026-05-12 22:59 KST
This analysis uses public data sources. Investment decisions are your own responsibility.
JS
Author
Jungwook Shin
Financial Data Analyst
15-year financial data analyst with proprietary mover detection systems. Real-time catalyst analysis across US, Korea, and Japan markets.

프로필 보기 →

Editorial & Policies

💼 Recommended Brokers

Charles Schwab
All-around US broker. Free commissions, banking integration, excellent research.

→ Charles Schwab

Interactive Brokers
Best for international + active traders. 150+ markets, lowest margin rates.

→ Interactive Brokers

Fidelity
Best for retirement. Free ZERO expense ratio funds.

→ Fidelity

Affiliate disclosure: We may receive compensation if you open an account through these links. This does not affect our analysis.

Leave a Comment

Your email address will not be published. Required fields are marked *

Scroll to Top
𝕏 ƒ in 🔗