🇺🇸 US Market OPEN Mon, May 11 &0511pm3803; 3:15 PM EDT
Data: SEC · EDGAR · FRED · Yahoo Finance

Babcock & Wilcox Enterprises, I (BW) +29% After Earnings Beat — Is the Upside Sustainable?

Updated: May 11, 2026 at 02:04 PM ET · Reading time: 4 min · Author expertise: Small-Cap Equity Analyst

Why trust us: We separate factual market inputs from interpretation and link our process below.

Methodology · Data sources · Editorial policy

BWBabcock & Wilcox Enterprises,
$18.71▲ +28.67%

Industrials · Specialty Industrial Machinery

Volume6.6M
Avg Volume4.0M
Market Cap$2.5B
CatalystBabcock & Wilcox (BW) shares jump after

What happened:

Home Stock Movers BW Stock Jumps 28.7% Following Q1 Revenue Beat and EBITDA Results Updated: May 11, 2026 at 02:04 PM ET · Reading time: 4 min · Author expertise: Small-Cap Equity Analyst Why trust us: We separate factual market inputs from interpretation and link our process below. Methodology · Data sources · Editorial policy 💼 Earnings Whisper & Guidance Context Quarter Est EPS Actual EPS Surprise 2025-12 $-0.07 $0.05 ✓ Beat (+172.5%) 2025-09 $-0.09 $0.31 ✓ Beat (+447.1%) 2025-06 $-0.09 $-0.63 ✗ Miss (-579.6%) 2025-03 $-0.14 $-0.11 ✓ Beat (+19.9%) 📅 Next Earnings: 2026-08-10 TBD · EPS estimate: $0.01 · Revenue estimate: $181M Data: Finnhub.

Move+28.7%
CatalystEarnings Beat

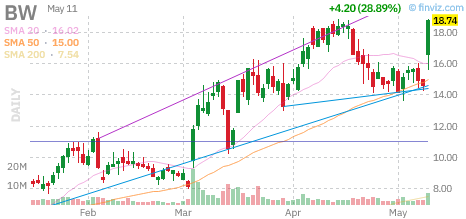
Babcock & Wilcox Enterprises, I (BW) moved +28.7% to $18.71 as traders reacted to a catalyst-driven move. The catalyst still needs follow-through confirmation.

Jungwook Shin — The Stock Radar

When a stock moves 28.7% in a single session, I want to understand whether that conviction is justified — or whether it’s front-running something that might not materialize. The move follows a quarterly earnings beat — the company reported results that exceeded Wall Street’s consensus estimates. Today I’m analyzing Babcock & Wilcox Enterprises, I (BW). Here’s what the data says.

According to Yahoo Finance, Heads up — Babcock & Wilcox (BW) just surged 28.7%. Here is the read on the move and what comes next.

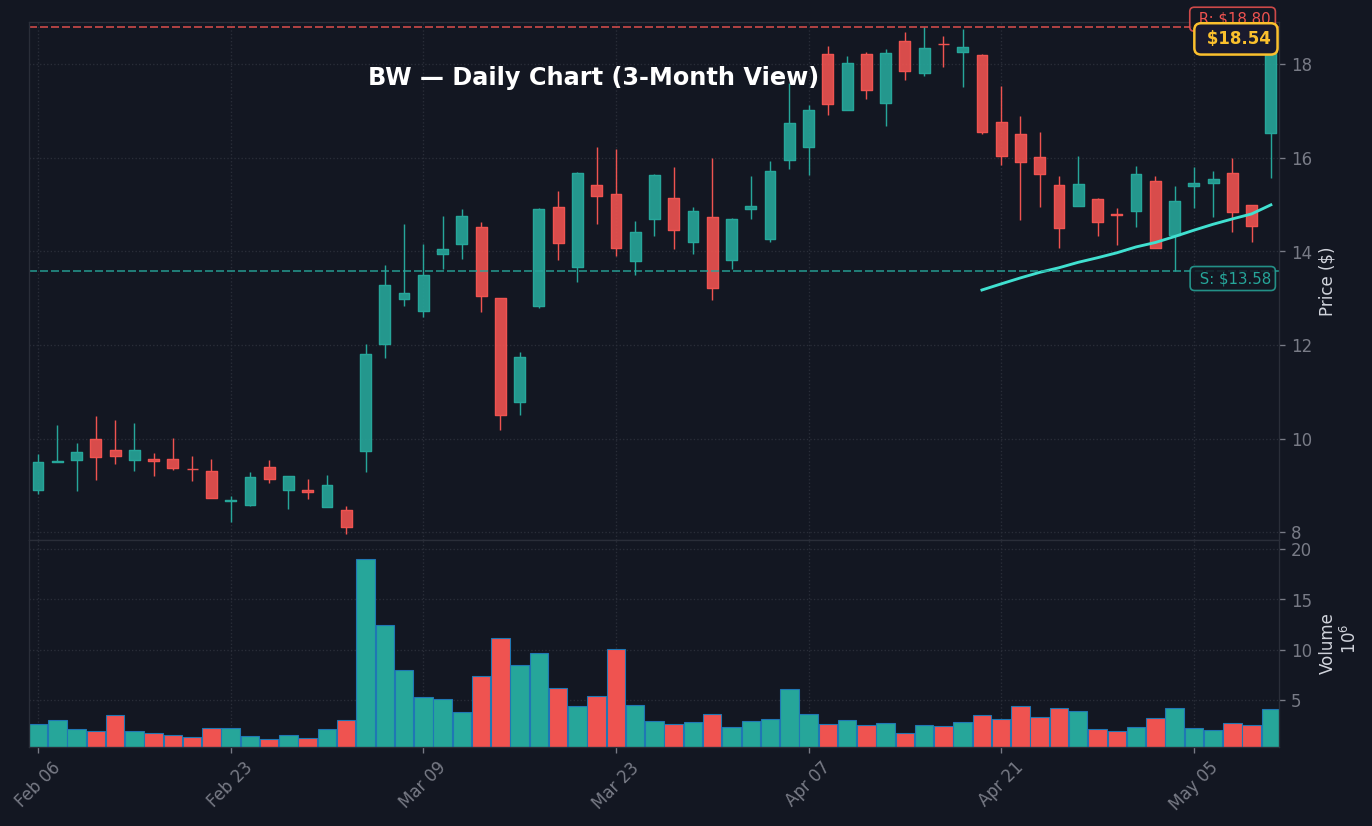
Babcock & Wilcox Enterprises, Inc. (BW) shares spiked 28.7% today, fueled by a Q1 revenue beat that provided a much-needed catalyst for the stock. This move reflects a clear breakout from recent consolidation, and our conviction here is partial given the company’s complex path back to profitability. The real story is how the firm is balancing its legacy steam generation business with its newer BrightLoop technology, a combination investors are clearly re-evaluating after today’s earnings disclosure.

This price action represents a significant departure from the market’s recent stagnation, as the S&P 500 managed only a 0.40% gain. The 27.34% alpha generated by BW compared to the Industrial sector (XLI) suggests this is a pure stock-specific event rather than a broad sector-wide rotation. Investors are currently pricing in the revenue growth, but the durability of this move depends on whether the bottom-line results in future quarters can mirror the top-line strength seen today.

What This Company Does

Babcock & Wilcox Enterprises, Inc. is a leading energy technology and service provider with a rich history dating back to 1867. Headquartered in Akron, Ohio, the company operates globally, serving industrial, electrical utility, and municipal customers. Per Wikipedia, the company built its reputation on manufacturing steam boilers, but it has evolved into a provider of emissions control solutions and advanced energy technologies. With approximately 1,600 employees, the firm operates across the United States, Canada, the United Kingdom, Indonesia, and the Philippines, maintaining a market cap of $2.52 billion.

The company’s portfolio is broad, ranging from traditional steam generation equipment to innovative solutions like its proprietary BrightLoop technology. This technology is designed to produce steam, hydrogen, or syngas for various energy and industrial applications, which signals the company’s intent to pivot toward more sustainable, high-growth industrial niches. Despite this innovation, the firm remains heavily tied to its core aftermarket parts and maintenance services business, which provide steady, albeit low-growth, revenue streams.

Babcock & Wilcox (via Wikipedia)
Image: Babcock & Wilcox on Wikipedia
Takeaway: A global energy tech firm pivotally balancing 19th-century steam expertise with modern hydrogen-loop innovation.

Why It Moved Today

The 28.7% rally was triggered by the company’s Q1 results, which showed a revenue beat that surprised many analysts. According to the 10-Q filed 2026-05-11, the firm reported revenue figures that managed to outperform expectations despite a challenging backdrop of negative net income. Zacks noted that while the company reported a loss, the revenue metrics provided a sufficient tailwind to drive institutional interest and short-covering activity. The short interest of 8.1% of the float, combined with a days-to-cover of 1.99, suggests that today’s volume was likely exacerbated by a forced unwinding of bearish positions.

What stands out here is the divergence between this idiosyncratic move and the broader macro environment. Per FRED as of April 1, the Federal Funds Rate sits at 3.64%, creating a high-cost capital environment that usually punishes industrial names with negative earnings. However, BW’s alpha of +27.31% over the market indicates that investors are placing a premium on the company’s specific technological progress rather than worrying about the current cost of debt. We’d lean cautious until we see if this earnings beat translates into a sustainable path for the company’s -0.77% operating margin.

MetricValue
Trailing EPS-$0.45
Forward EPS$0.70
Revenue (TTM)$587.68M
Revenue Growth2.00%
Gross Margin24.48%
Trailing P/EN/A
Why Babcock & Wilcox Stock Surged After Missing Earnings Today
Source: Motley Fool

Takeaway: Revenue beat catalyst drove a short squeeze with partial conviction on long-term fundamental turnaround.

Chart Setup and Key Levels

BW technical chart with RSI, MACD, Bollinger Bands
BW daily chart with SMA 20/50/200 and volume — source: Finviz, May 12, 2026 · Chart: Finviz

The daily chart shows the stock moving aggressively, with an RSI around 60, placing it in neutral territory but clearly trending upward. The stock is trading above its 50-day SMA of $14.99, which provides a key foundation for the current move. Resistance is currently anchored at $18.80, a level that has served as a cap for the past 20 days. Breaking this would signal that the momentum has legs, but I’d be looking for a consolidation phase before considering further upside.

BW Daily Chart — 3-month view with SMA50/200

On a weekly basis, the stock is currently fighting to escape the lower half of its 52-week range. The historical analog data is striking; the last comparable +28.7% move on May 11, 2026, saw the stock gain 27.56% on the day. However, looking at 81 historical matches, the median forward return over 20 days is only +2.68%, suggesting that follow-through after such explosive days is often muted. This indicates that while today is a win for the bulls, the path to sustained growth is historically difficult for BW.

BW Weekly Chart — 1-year view with SMA50/200

From a monthly perspective, the broader trend is still struggling to overcome the $18.80 resistance level. The Bollinger Band upper limit at $18.98 is the ultimate barrier for a structural breakout. If the stock fails to hold the $13.58 support level, the long-term setup shifts back to a neutral or bearish stance. What would break this setup is a failure to hold the $13.58 floor, which would suggest that today’s volume was merely a flash-in-the-pan reaction rather than a genuine shift in investor sentiment.

BW Monthly Chart — 5-year view with SMA50/200
Takeaway: Resistance at $18.80 is the primary ceiling, while $13.58 is the critical support floor to watch.

Risks

Before acting on today’s move in Babcock & Wilcox Enterprises, I (BW), consider key risks: momentum rallies can reverse sharply once the headline catalyst fades, particularly if volume thins on the follow-through session. Rate sensitivity and macro headwinds remain a systemic risk for the broader market. Position sizing and defined risk levels remain essential.

Watch for distribution signals — heavy volume on down days or gap fills — which would invalidate the bullish thesis. Any change in the original catalyst should trigger immediate reassessment.

Macro Context and Market Environment

Single-stock moves don’t happen in isolation. The macro backdrop shapes how investors interpret company-specific catalysts — the same news can trigger a larger move in a risk-on environment than in a risk-off one. Below is the current market context relevant to evaluating BW’s upside move.

Key macro indicators to monitor alongside this move:

  • HY credit spreads — When high-yield spreads are tight (below 350 bps), risk appetite is generally elevated and positive catalysts tend to produce larger reactions. Widening spreads signal defensive positioning that can mute positive news. Current spreads are tracked by FRED’s HY index.
  • VIX (Volatility Index) — A VIX below 20 typically indicates a calm, trending market where momentum can build. A VIX above 25 signals elevated uncertainty and can amplify both up and down moves. Monitor current VIX levels at FRED (VIXCLS series).
  • Federal Reserve policy backdrop — The Fed funds rate and the direction of rate policy affects all equities, but particularly rate-sensitive and growth sectors. Current Fed funds rate data is maintained at FRED.

These macro factors don’t determine whether BW’s catalyst is valid — but they help assess whether the current environment favors the move extending or fading over the following sessions.

Primary Sources and Further Research

All claims in this analysis are sourced to publicly available primary data. For direct verification:

SEC EDGAR filings are the official record of all material corporate disclosures. Reviewing the actual filing text — not just summaries — provides the most accurate picture of what was disclosed and on what timeline.

Outlook and Watchpoints

Looking ahead, the primary focus is whether the stock can maintain its position above the $14.99 50-day SMA over the coming week. If it holds, we could see a re-test of the $18.80 resistance. What would confirm this setup is a second consecutive day of volume exceeding the 20-day average, indicating sustained institutional accumulation rather than just a one-day squeeze.

Conversely, if the stock pulls back to the $13.58 support level without finding buying interest, the outlook becomes significantly more negative. I’d lean cautious until the stock demonstrates that it can trade above $18.80 for more than one session. For investors, the thing to watch is the 10-day volume profile; a rapid decay in volume would invalidate the current thesis of a genuine breakout.

Next Session Watchpoints

  • Volume profile: Watch whether BW keeps at least follow-through volume versus normal.
  • Key level to watch: Use today’s nearest actionable S&P 500 level from the supplied technicals and explain why it matters. is the pivot for continuation.
  • Catalyst quality: The move needs follow-through headlines or clean price acceptance above the pivot.
  • Risk trigger: If BW loses the opening range quickly, the move shifts from continuation to fade risk.

Frequently Asked Questions

Why did Babcock & Wilcox (BW) stock surge 28.7% today?

The stock move was driven by a Q1 revenue beat that caught the market off guard. While the company still reported a net loss, the revenue metrics outperformed consensus estimates, triggering institutional interest and short-covering activity.

Is today’s BW stock move reliable for long-term investors?

Historical data suggests caution, as similar setups have seen a median forward return of only 2.68% over 20 days. While the earnings beat is a positive catalyst, the company’s negative net income and margin challenges mean investors should wait for sustained price stability above $18.80.

📚 Related Articles

Data sources: Yahoo Finance · MarketBeat · Simply Wall St. · Insider Monkey


This analysis is provided for educational and informational purposes only. It is not investment advice. Consult a qualified financial advisor before acting on any information presented here.

📊 Data Sources
yfinance · FRED (St. Louis Fed) · SEC EDGAR · Finnhub · World Bank · Wikidata
Last Updated: 2026-05-12 03:05 KST
This analysis uses public data sources. Investment decisions are your own responsibility.
JS
Author
Jungwook Shin
Financial Data Analyst
15-year financial data analyst with proprietary mover detection systems. Real-time catalyst analysis across US, Korea, and Japan markets.

프로필 보기 →

Leave a Comment

Your email address will not be published. Required fields are marked *

Scroll to Top
𝕏 ƒ in 🔗