
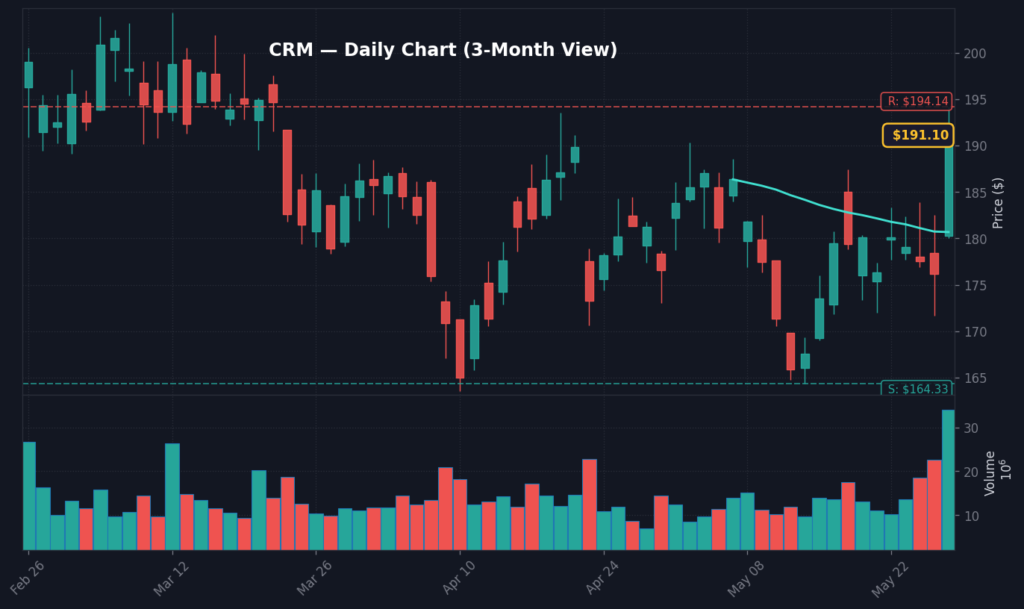
CRM +8.5% on May 31: Benioff Calls $11.1B Q1 a ‘Sign’ as Salesforce Bounces From
Salesforce (CRM) trades at $191.12, up 8.49% at 11:02 AM ET on May 31 after a $11.1B fiscal Q1 print and Benioff calling the quarter a ‘sign.’ The gap matters less than
Salesforce (CRM) trades at $191.12, up 8.49% at 11:02 AM ET on May 31 after a $11.1B fiscal Q1 print and Benioff calling the quarter a ‘sign.’ The gap matters less than
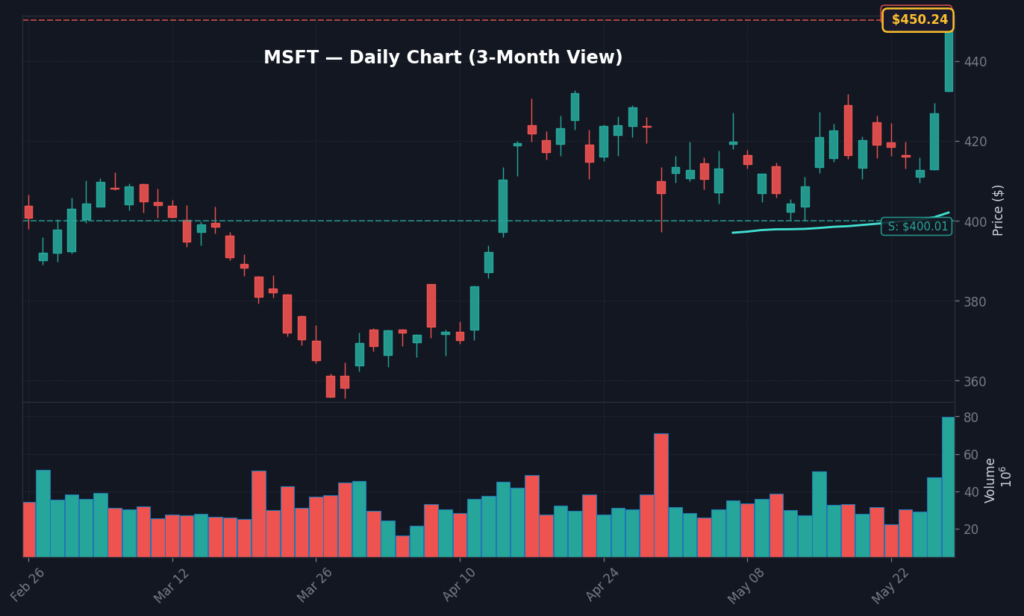
Microsoft tagged $450.24 at 5:18 AM ET Sunday on a 1.2M-share ECN print after Invesco Summit Fund’s Q1 disclosure hit EDGAR. The 5.44% gap is positioning, not re-rating
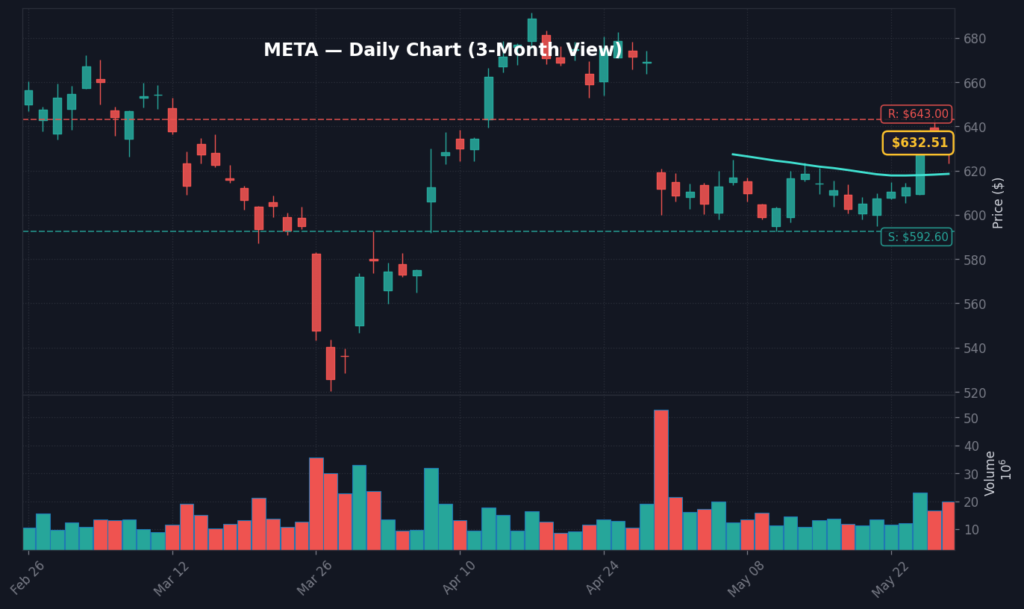
META filed a Form 8-K on May 29 into a tape with VIX at 15.7 and 10Y at 4.45%. Watch Monday’s open: low vol means gap risk is asymmetric.
A 2026 guide to the Money Flow Index: the four-step formula, 80/20 thresholds, divergence and failure-swing signals, false-signal failure modes, and how MFI stacks up against RSI, OBV, and Chaikin Money Flow — with a worked 14-session calculation.
Seven 4%+ yield names that pass payout-ratio and five-year DPS filters, ranked by risk/reward against a 4.41% 10Y and 5.1% money market alternative. VZ, MO, PFE, BMY, KMI, O, MMM — with entry levels, coverage math, and the August QRA / September FOMC catalysts that re-rate the cohort.
XLK at $180.39 with $103.3B AUM and a +30.39% three-month run — but top three names (NVDA, MSFT, AAPL) equal ~48% of NAV. A buy-side breakdown of May 2026 weights, the historical MOVE-index calibration, the 2022 -34.7% precedent, and concrete portfolio sizing math.
META at 16.9x forward vs GOOG at 26.3x — the widest mega-cap ad-platform multiple gap in three years. Quantified bull/bear scenarios, the FTC Instagram binary, and what the July 30 Q2 print decides.
AAPL closed $0.17 above its average analyst target after a 13% one-month run; GOOG still has $38 of consensus upside on faster growth and a 5.9-turn cheaper forward multiple. Where the relative-value setup actually sits for May 2026.
The 200-day SMA is the average of the last 200 daily closes — a trend filter institutions watch because algorithms watch it. This guide covers the formula, the Golden/Death Cross with Bespoke’s 1950-onward stats, a worked NVDA reclaim from $156 to $495, and how to read SPY 200-day breaks against HY
The 50-day SMA is Wall Street’s most-watched intermediate trend line. A complete 2026 guide covering the calculation, slope and crossover signals, NVDA and AAPL worked examples, five common mistakes, and the cross-asset checks institutional desks layer on top.