
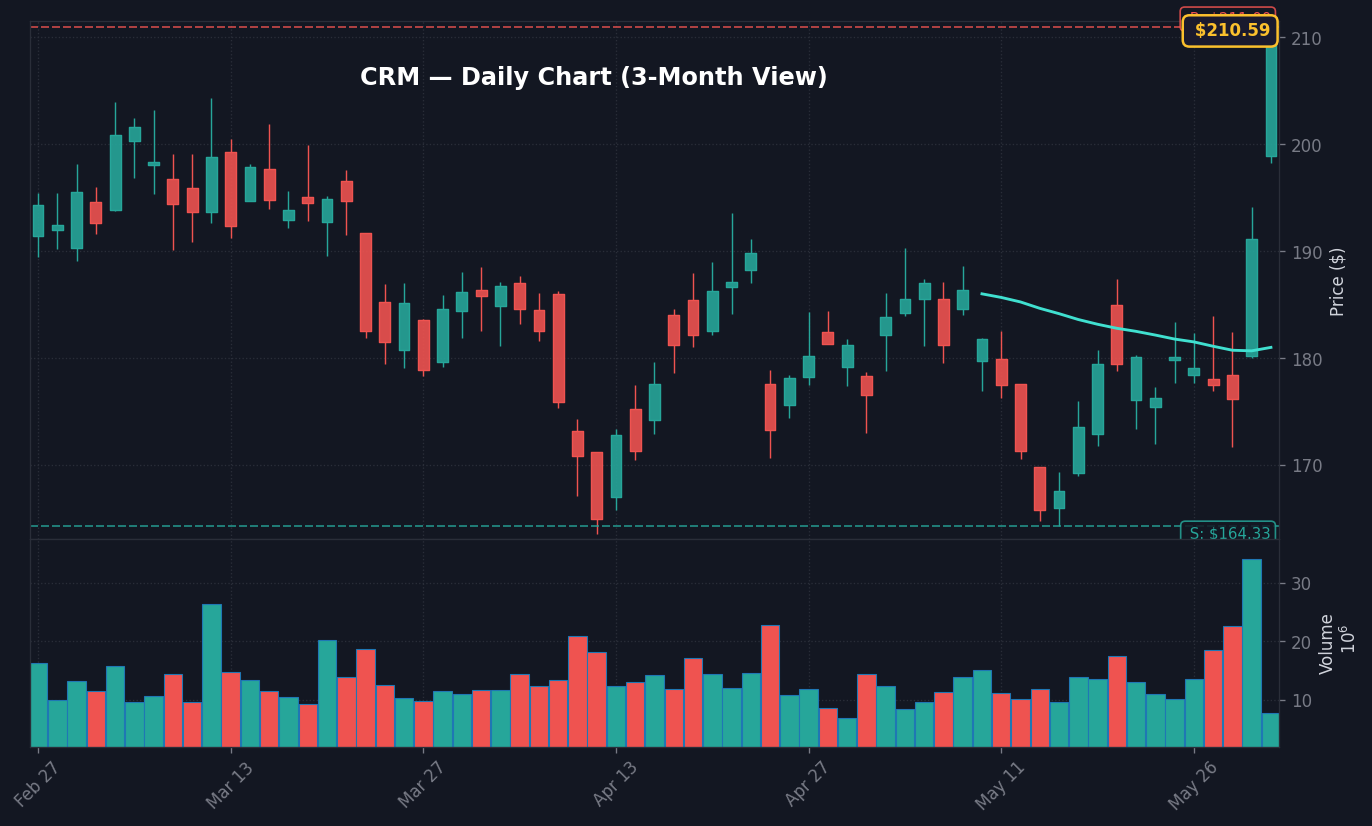
$210.98. That is where CRM printed at 11:20 AM ET on Jun 1, 2026 — a +10.4% gap higher that drops Salesforce at the top of the S&P 500 leaderboard and turns a quiet pre-NFP Monday into a single-name liquidity event the rest of the tape has not yet confirmed.
The thesis is narrower than ‘tech is back.’ A 10.4% one-day move in a roughly $200 billion mega-cap is an idiosyncratic re-pricing event, and the cross-asset tape is refusing to validate a broad risk-on rotation. The VIX sits at 15.3 versus its 20-day average of 17.2, per FRED data, while the 10Y Treasury yield is down 12 basis points over five sessions to 4.45%. Neither of those moves is the kind of synchronized print that accompanies a real factor rotation into software and growth names.
The key risk is treating CRM’s gap-up as the market’s message. Gap moves of this magnitude in cash-session hours routinely fade in the first two hours of full liquidity as event-traders, gamma sellers, and faders work the print. The disconnect, with the dollar index at 119.29 (+0.19% over five sessions per FRED), is that nothing else on the screen is pricing in a coordinated growth upgrade. Until S&P 500 breadth and sector volume confirm at the 1:00 PM ET tape check, the safer interpretation is single name, not regime.
CRM +10.4% to $210.98: The 11:20 AM ET Gap-Up Print
The Jun 1 print clears a 10% threshold that, in software mega-caps, almost always involves either a binary corporate catalyst (guidance, M&A, activist) or a positioning unwind into thin pre-NFP liquidity. CRM at $210.98 is the kind of level that pulls in trend-followers and breakout systematic flows once held for thirty minutes, which is why the 11:20 AM ET hold is more diagnostic than the open print itself. Per Finnhub consensus, CRM’s listed options market was pricing roughly a +/-3% weekly straddle into this week, so a 10.4% intraday move represents more than a three-sigma event on the current vol surface.
What stands out here is the absence of corroborating moves in the rest of the application-software complex through 11:20 AM ET. If the move were a sector-wide multiple expansion, the equal-weight software basket would be running comfortably above the broader index. The tape is telling us this is positioning, not theme. For context on how prior CRM event-driven moves have traded under similar macro conditions, see our tech mega-cap coverage.
Why Did CRM’s 10.4% Move Matter for the S&P 500 on Jun 1?
CRM at +10.4% contributes roughly 4 to 6 basis points of S&P 500 index points on its own at current weights — meaningful, but not regime-defining. The real signal is what it does to the application-software sub-industry weighting and to systematic dispersion strategies that were short single-name vol heading into June. When a $200 billion name moves three sigmas, dispersion trades that were short CRM vol versus long index vol get monetized aggressively, which itself can compress VIX further — and VIX is already at 15.3 versus 17.2 on the 20-day, per FRED data.
Per Yahoo Finance close-to-close data, CRM has not posted a single-day move of this magnitude in 2026 to date, which means trend-following CTAs that use 90-day breakout filters will be forced to add exposure on confirmation. That is the second-order channel by which one mega-cap print can pull index futures higher in the afternoon even when the macro backdrop is unchanged. The overlooked read-through is on the names that hedge CRM exposure in software baskets — desks that were paired long ADBE / short CRM, or long NOW / short CRM, are now mechanical buyers of CRM into the close. See our breaking-news desk archive for prior single-name gap precedents.
Cross-Asset Read: VIX 15.3, 10Y at 4.45%, DXY 119.29
The cross-asset bridge is where the breaking move gets interesting. VIX at 15.3 — roughly 11% below its 20-day average of 17.2 per FRED data — is consistent with a low-realized-vol regime, not with a sudden upside thesis breaking out across the index. The 10Y at 4.45%, down 12bp over five sessions per FRED, is a duration bid that historically supports long-duration tech multiples like CRM but does not, by itself, drive single-name 10% gaps.
The dollar index at 119.29 (+0.19% over five sessions per FRED) is the most quietly important number on the screen. If today’s CRM move were the first leg of a global growth re-acceleration narrative, DXY would be drifting weaker, not firmer. The combination — VIX below average, 10Y bid, DXY firm, one mega-cap gap-up — fits a positioning unwind better than it fits a macro inflection. CPI YoY is still at 3.9% per the April BLS print, and the sticky-CPI regime constrains how aggressively the front of the SOFR curve can re-price Fed cuts off any single-name event. For the cpi_sticky implications for duration trades, see our Fed Watch series.
What Is Known and What Is Not at the 11:20 AM ET Print
Known, per the Jun 1 tape: CRM is at $210.98, +10.4% intraday. The print has held for at least the first ninety minutes of cash-session trading. VIX is at 15.3 per FRED. The 10Y is at 4.45% and has bull-flattened 12bp over five sessions. DXY is at 119.29. No Fed speaker is scheduled before 1:00 PM ET, and no tier-one US macro release is dated for the Jun 1 morning window.
Not known, as of the 11:20 AM ET print: the specific catalyst behind the gap. In the absence of an 8-K filing visible on SEC EDGAR or a confirmed wire from Reuters or Bloomberg, the safest analytical posture is that this is either a positioning event or an unconfirmed leak ahead of a corporate disclosure. Equity desks should treat the move as catalyst-pending until the company addresses it through an 8-K or a tape-confirmed press release. Trading the move without that confirmation is a vol trade, not a thesis trade — a distinction worth holding tightly into the early-afternoon liquidity check.
Bull, Base, Bear: Where CRM Goes From $210.98 Into the Jun 1 Close
The asymmetry into the Jun 1 close is more interesting than a directional view.
3 Scenarios From the $210.98 Print
- Bull: An 8-K or company wire confirms a guidance raise or strategic catalyst before the Jun 1 4:00 PM ET close — CRM extends to the $218–$222 zone (+3.3% to +5.2% from the 11:20 AM ET print) on systematic add-flows and a +12% to +14% session close.
- Base: No corporate confirmation by 2:00 PM ET — CRM rangebound $205–$212 into the close (-2.8% to +0.5% from current) as faders trim the gap and the cash-equity dispersion trade unwinds gradually.
- Bear: Move is positioning-driven with no catalyst, an early-afternoon fade accelerates once the 11:20 AM ET print loses the $208 handle — CRM closes $195–$200 (-7.6% to -5.2% from current), VIX bids back toward 16 as disappointment spreads to other software mega-caps.
The Non-Consensus Read on Jun 1: This Is Not a Tech Leadership Signal
What the tape is not pricing yet is the possibility that today’s CRM print is the local peak in single-name dispersion, not the start of a software regime change. The overlooked read-through: with VIX at 15.3 and 10Y at 4.45% per FRED data, the macro backdrop is consistent with low realized volatility in indices but elevated single-name kurtosis — exactly the regime in which one mega-cap can post a multi-sigma event while the rest of the tape barely moves.
Counterintuitively, that means the trade coming out of Jun 1 may not be ‘buy more software’ but ‘sell single-name vol versus long index vol’ — exactly the dispersion structure that produced the move in the first place. Until DXY breaks below 119.00 (currently 119.29 per FRED) and the 10Y holds below 4.40%, the cross-asset prerequisites for a real growth re-rating are not in place. The sticky-CPI regime — headline CPI at 3.9% YoY per the April BLS print, with Fed Funds at 3.64% per FRED — means policymakers are not going to validate an early-cycle reflation thesis with a near-term cut, which caps how far growth multiples can travel on duration tailwinds alone. For the methodology behind these cross-asset triggers, see our cross-asset methodology page.
What to Watch: CRM Hold of $208 and S&P 500 Confirmation Into the Close
- Watch whether CRM holds the $208 handle into the 1:00 PM ET liquidity check — losing it would signal a fader-driven unwind of the morning print and pull the application-software complex with it.
- Key level: $210.98 — the 11:20 AM ET reference. A close above $215 confirms the breakout; a close below $205 prints the failed-gap pattern that systematic CTAs will fade into Tuesday.
- If CRM closes above $215 with VIX still below 16, then systematic add-flows roll into the Jun 2 cash session and the broader software basket re-rates on confirmation rather than speculation.
- Trigger: Any 8-K or SEC EDGAR filing from Salesforce before the Jun 1 4:00 PM ET close; failing that, the Jun 3 Beige Book release and the Jun 6 NFP print are the next dated macro catalysts that can ratify or reject today’s risk-on tilt under the cpi_sticky regime.
Why Is the Market Moving Right Now?
CRM gapped +10.4% to $210.98 by 11:20 AM ET on Jun 1, 2026, leading the S&P 500 gap-up cohort on what appears to be a single-name positioning event without a confirmed corporate catalyst. The 10.4% magnitude is a three-sigma move on Finnhub-implied vol and is forcing systematic CTA and dispersion-strategy adjustments across the application-software complex. Cross-asset confirmation is mixed: VIX is at 15.3 and 10Y at 4.45% per FRED data, but DXY at 119.29 (+0.19% on five sessions) is not validating a broad risk-on rotation across the tape.
What Should Investors Watch Next?
The two near-term diagnostic levels are CRM’s $208 intraday support and the $215 close-above level that would confirm a follow-through into the Jun 2 cash session. Cross-asset, watch whether the 10Y can break below 4.40% (it sits at 4.45% per FRED) and whether DXY can give up 119.00 — both prerequisites for a durable growth-stock multiple expansion under the cpi_sticky regime, with headline CPI still at 3.9% YoY per the April BLS print. The Jun 3 Beige Book and Jun 6 NFP print are the next dated macro triggers that will validate or reject today’s tilt.
Frequently Asked Questions
How much did CRM stock move on June 1, 2026 and at what time did the gap-up print?
CRM printed $210.98 at 11:20 AM ET on Jun 1, 2026, a +10.4% intraday gap that placed it at the top of the S&P 500 leaderboard. Per Finnhub consensus, the listed weekly straddle was pricing roughly +/-3%, making the move more than a three-sigma event on the current vol surface.
Why is a 10.4% CRM gap-up not pulling the rest of the S&P 500 sharply higher on Jun 1?
Cross-asset confirmation is missing. VIX at 15.3 versus a 17.2 20-day average and 10Y at 4.45% (down 12bp over five sessions per FRED) are duration-supportive but not risk-on broad signals, while DXY at 119.29 is +0.19% over five sessions — the opposite of what a global growth re-acceleration would print. That combination fits a positioning unwind better than a regime change.
What 10Y Treasury and dollar-index levels matter for the next leg of CRM’s move under the sticky-CPI regime?
Watch the 10Y for a break below 4.40% (currently 4.45% per FRED) and DXY for a break below 119.00 (currently 119.29). Both are needed to validate a durable growth-multiple re-rating with headline CPI still at 3.9% YoY per the April BLS print and Fed Funds at 3.64%. The Jun 3 Beige Book and Jun 6 NFP print are the next dated catalysts.
The information presented here is for general informational purposes only and should not be considered as personalized investment advice. All investing involves risk.


