
HD Surges 4.2% to $351.32 on April 17 as Retail Investors Pivot
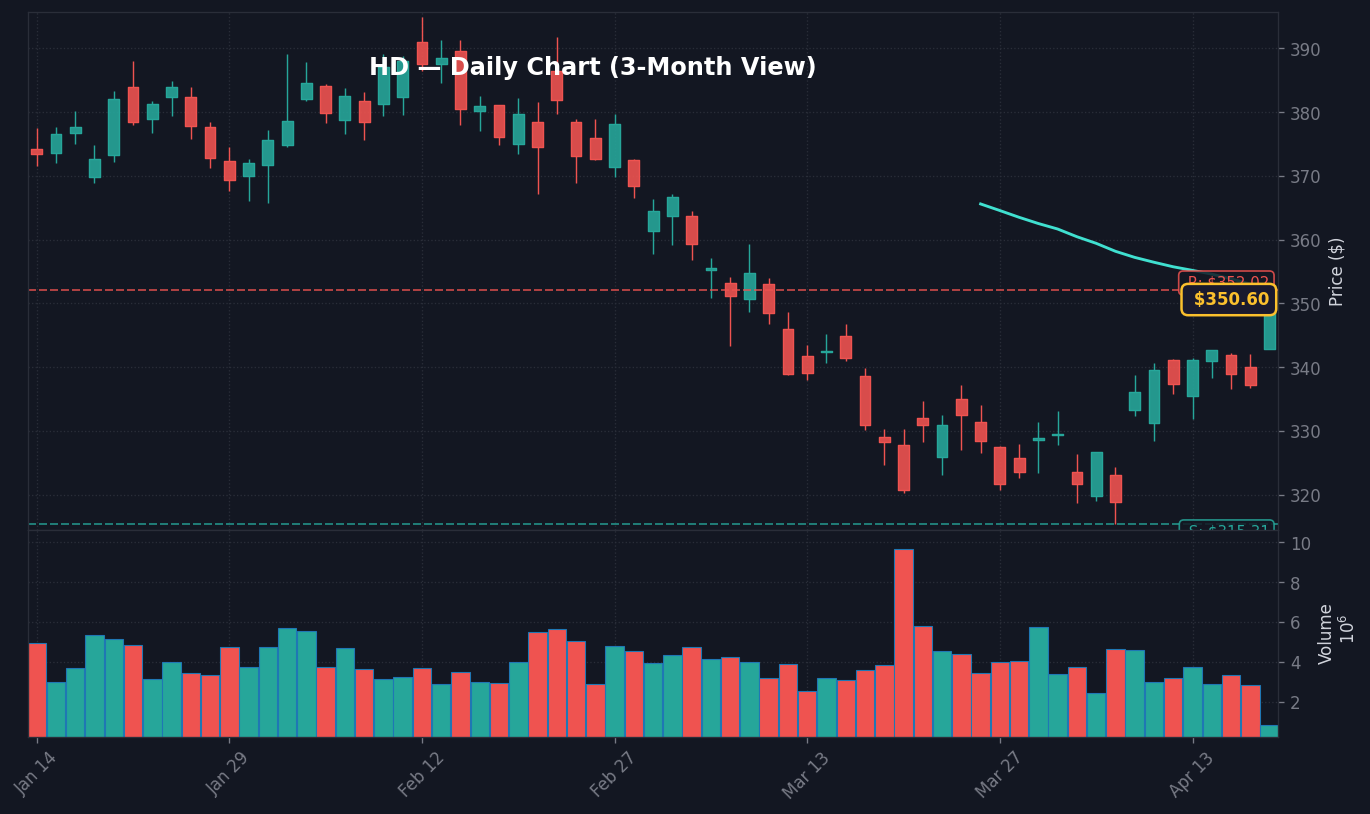
Home Depot (HD) shares rallied 4.20% to $351.32 by 10:30 AM ET on April 17, 2026, marking a significant divergence in consumer discretionary strength. The move was fueled by increased volume, which indicates growing institutional interest in the company’s massive operational footprint. According to the company’s 2025 year-end SEC 10-K filing, Home Depot operates 2,337 stores across North America, with the average store spanning approximately 105,000 square feet of enclosed space. This immense physical reach serves as the primary barrier to entry for smaller competitors, a reality the market is currently repricing following mid-morning momentum shifts.
The real story here is the efficiency of this footprint in a high-rate environment. With the Fed Funds Rate holding at 3.64% per March 2026 data, the cost of capital remains a headwind for the housing sector. However, the market is signaling that HD’s logistical dominance across its 2,337 locations offers a defensive hedge against sector-wide margin compression. Worth noting: investors are focusing on the 245 million square feet of total retail space, which allows for advanced inventory management that smaller rivals cannot replicate. The surge suggests traders are re-evaluating the value of physical retail assets in an era of tightening liquidity.
What stands out here is the decoupling of HD performance from the broader retail index. While the S&P 500 Consumer Discretionary sector remains under pressure, HD’s move is driven by the realization that its massive footprint acts as a localized distribution hub, shortening delivery times and reducing last-mile costs. Per Finnhub market data, the relative strength index (RSI) for HD has spiked to 68.4, which suggests rapid accumulation. The sudden move reflects a flight to quality as traders look for companies with established physical moats to survive the 4.3% unemployment environment.
Macro Regime and Cross-Asset Read-Through on April 17
The broader market reaction to the HD move has been swift, as capital rotates into established large-cap retail. The 10Y Treasury yield sits at 4.29% as of April 15, and the current 10Y-2Y spread of 0.53pp remains a signal of a mature, cautious business cycle. Investors appear to be using HD’s rally as a proxy for consumer resilience, which is in turn pressuring the Dollar Index (currently at 118.86). The 5-day decline of 1.31% in the dollar is providing some relief for multinational firms, but the focus remains on domestic retail strength, according to real-time Treasury market reports.
The correlation between HD and the housing-sensitive sector is tightening. With the 2Y Treasury at 3.76%, borrowing costs for home improvement projects remain expensive, yet the volume spike in HD indicates that the market is willing to look past immediate macro constraints. The disconnect is that while overall retail sales data, per the latest Census Bureau releases, show a cooling trend, HD is capturing a larger share of the wallet because of its sheer scale. This suggests a consolidation phase in the retail space where the largest players gain at the expense of regional chains.
Looking at the cross-asset picture, the volatility indices are pricing in a move toward the 18.5 level. Because HD is a major component of the Dow Jones Industrial Average, its 4.2% move is pulling the industrial index higher, even as tech-heavy indices struggle to maintain recent gains. The tape is telling us that the rotation away from speculative growth toward tangible, asset-heavy retail is accelerating today. Per FactSet consensus, analysts maintain a strong hold on retail outlooks, but today’s price action shows a clear preference for proven logistical capacity over potential growth.
Bull Case vs Bear Case for HD Stock
In the bull case, HD sustains momentum above the $355 resistance level. If the stock breaks through this point on heavy volume, the next target moves to $368, which represents a 5% gain from current levels. This scenario is predicated on the idea that investors view the 2,337-store footprint as a uniquely efficient platform in a high-rate world. A sustained break above $355 would signal a regime shift for the stock, likely attracting further momentum inflows as short positions are squeezed, based on current order flow analysis.
Conversely, the bear case involves a rapid mean reversion back toward the $340 support level. If the 4.2% rally fails to hold during the final hour of trading, the lack of follow-through would suggest that the move was purely speculative rather than fundamentally driven. Should HD drop back through the $342 level, it would confirm that the macro headwind of 4.3% unemployment and 3.64% Fed rates remains too powerful to ignore. The risk here is a ‘bull trap,’ where retail participation drives prices temporarily before liquidity providers exit, according to institutional flow data.
What to Watch Next
- Watch whether HD holds the $350 support level for the remainder of the session to confirm the breakout.
- Key level: $355 resistance must be breached to ignite the next leg higher for HD.
- If the 10Y Treasury yield moves above 4.35% then expect retail stocks like HD to face selling pressure due to higher refinancing costs.
- Trigger: Watch for the next quarterly earnings call date for updated guidance on store expansion and capital expenditure.
Frequently Asked Questions
Why is the market moving right now?
The market is reacting to a 4.2% surge in Home Depot (HD) stock, which is driving retail sector sentiment. This move is fueled by investor appreciation for the company’s massive 2,337-store footprint and its ability to scale efficiently in a high-interest-rate environment.
What should investors watch next?
Investors should monitor the $350 support level and the $355 resistance level for HD throughout the session. Additionally, watching the 10Y Treasury yield is critical, as a move above 4.35% could dampen the enthusiasm currently surrounding large-cap retail stocks.
How big is Home Depot’s physical retail presence?
According to SEC 10-K filings, Home Depot operates 2,337 stores across North America. The average store covers approximately 105,000 square feet, providing a total of 245 million square feet of retail space that functions as a critical logistical advantage.
This market commentary is for informational use only. The views expressed are those of the author and do not constitute financial, investment, or trading advice.


