Market SnapshotAs of 2026-07-24 00:33 ET (intraday change)
S&P 500
$736.17
▼ -1.50%
Nasdaq 100
$688.94
▼ -2.33%
Russell 2000
$290.55
▼ -1.10%
VIX
19.72
▲ +18.51%
US 20Y
$83.00
▼ -0.52%
Dollar
101.50
▲ +0.35%
Gold
$371.01
▼ -2.14%
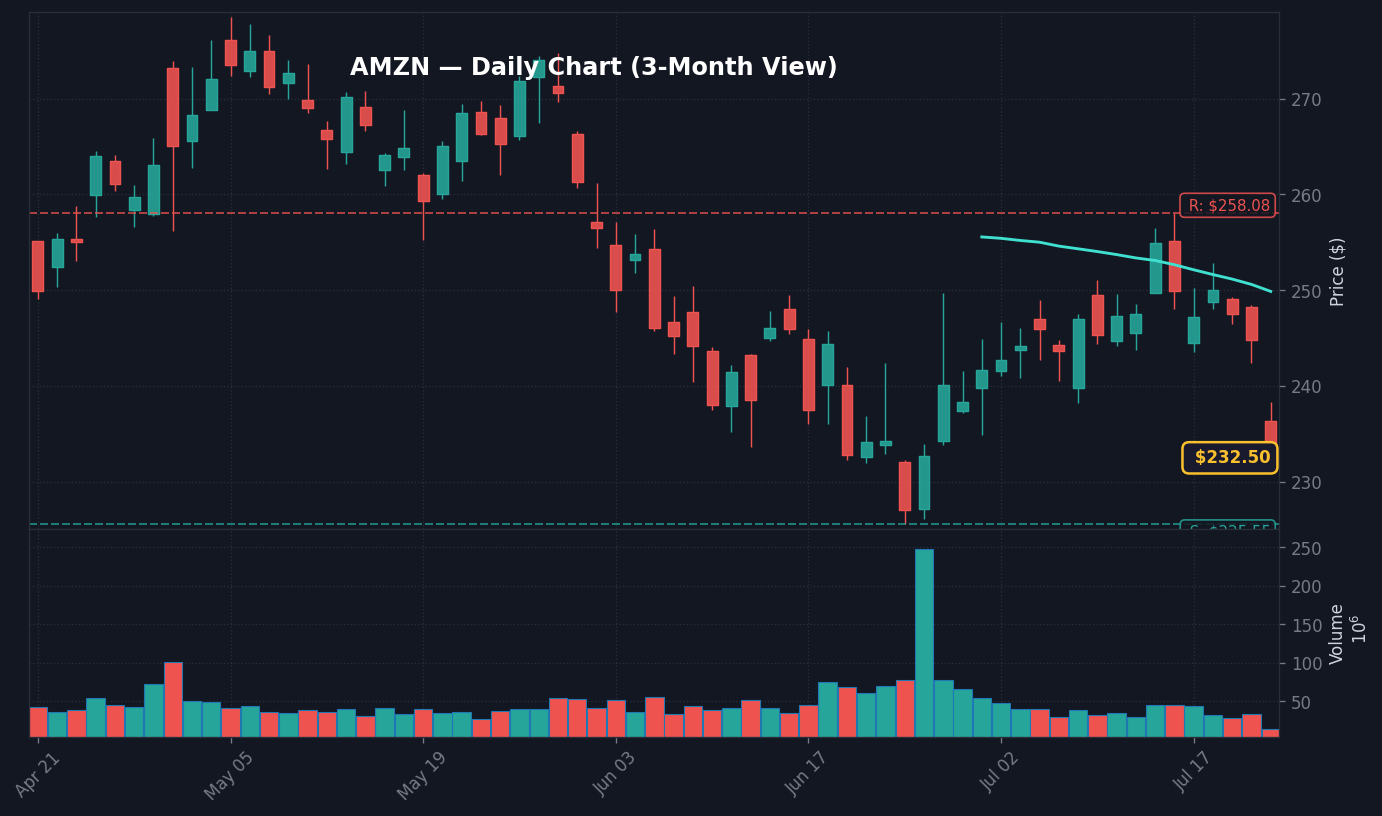
AMZN is down 5.1% to $232.41 at 11:28 AM ET on July 23, 2026, yet VIX is only 16.6 versus a 20-day average of 16.8, per the live breaking feed and FRED data. That is the tension traders should respect first. A high-severity mega-cap alert is hitting Amazon, but the volatility market has not yet repriced broad index stress.
The driver is the headline itself: AMZN -5.1%: Why Nvidia Stock Isn’t Rallying as It Should After Alphabet Earnings, per the live breaking feed. The feed gives AMZN’s move and price, but it does not provide Nvidia’s live percentage change, Alphabet’s EPS, Alphabet revenue, cloud revenue, or capex figures. That makes the first defensible read about positioning and confirmation, not a settled fundamental verdict.
The key risk is mistaking the 11:28 AM ET print for the full-market message before liquidity and confirmation arrive. Sticky CPI is still the macro ceiling: Fed funds is 3.63%, CPI YoY is 3.7%, and the 10Y Treasury is 4.63% after a five-day +8 bp move, per FRED data. In that regime, mega-cap growth stocks need cleaner read-throughs because higher yield pressure leaves less room for narrative-only multiple expansion.
AMZN was marked -5.0807% to $232.41 at 11:28 AM ET on July 23, 2026, per the live breaking feed. The event was labeled high severity and tied to Alphabet earnings and Nvidia’s muted follow-through, per the same feed, making Amazon the visible pressure point in a broader mega-cap read-through.
What stands out here is the sequencing. The alert is not framed as an Amazon-only operating update; it is framed as a market interpretation of Alphabet earnings and the missing Nvidia rally. When the market expects an AI-linked earnings print to lift the complex and instead sees AMZN down 5.1%, the first question is whether the trade was too crowded, too dependent on perfect capex assumptions, or both.
The available market snapshot does not include live S&P 500, Nasdaq, Dow, sector ETF, or breadth data. That matters because a 5.1% single-stock move in AMZN can be either a contained mega-cap repricing or the first leg of a broader growth-stock rotation. Without index and sector confirmation, the alert is urgent but not yet conclusive.
The tape is telling us to separate price from proof. The price is real: $232.41, per the live feed. The proof of contagion is not yet supplied.
Why Isn’t Nvidia Stock Rallying as AMZN Falls 5.1%?
Nvidia is not the quoted decliner in the feed; AMZN is. Nvidia matters because the headline frames Alphabet earnings as a test of the AI-capex halo, and that halo is not strong enough in the alert to stop AMZN selling pressure at $232.41, per the live breaking feed.
The disconnect is that Alphabet earnings would normally be expected to help the AI infrastructure narrative if traders read the print as confirmation of sustained compute demand. The alert says Nvidia stock is not rallying as it should after Alphabet earnings, but it does not provide Nvidia’s exact price, percentage move, or volume. That missing number is not a footnote. It is the difference between a clean semiconductor signal and a tentative cross-read.
For AMZN, the second-order issue is more subtle than a one-stock selloff. If the market is rewarding only the clearest AI beneficiaries and withholding the automatic halo from adjacent mega-caps, then Amazon’s $232.41 print becomes a test of selectivity. Traders are not paying for the whole mega-cap basket at once; they are forcing each name to prove where the earnings power sits.
The overlooked read-through: a muted Nvidia reaction after Alphabet earnings can be bearish for sentiment even without a direct negative Nvidia quote. It suggests the market may be moving from AI scarcity stories to AI return-on-capital scrutiny. That is a harder tape for AMZN when the stock is already down 5.0807%, per the live feed, because the burden shifts from theme ownership to margin evidence.
How Do 4.63% 10Y Yields and 16.6 VIX Shape the Alert?
The 10Y Treasury at 4.63%, up 8 bp over five days as of July 21, reduces the room for equity multiple expansion just as AMZN is down 5.1%, per FRED data and the live feed. VIX at 16.6, below its 16.8 20-day average, says the stress has not yet become a broad hedge scramble.
The cross-asset bridge is straightforward: a +0.37 percentage point 10Y-2Y spread and a 4.63% 10Y Treasury keep discount-rate pressure alive, while DXY at 120.53 with a five-day move of -0.17% shows this is not primarily a dollar squeeze, per FRED data. That combination points to valuation discipline rather than classic macro panic.
Counterintuitively, the low VIX is not automatically bullish for AMZN. It can also mean the market is not paying up for protection because traders see this as a stock-specific repricing. If AMZN remains under pressure while VIX stays near 16.6, the signal is narrower but still painful: large-cap dispersion is doing the risk control work that index volatility is not doing.
Sticky inflation keeps that dispersion relevant. Fed funds at 3.63% and CPI YoY at 3.7% as of June 1, 2026, per FRED data, argue against an easy multiple-rescue story. The unemployment rate at 4.2%, also in the FRED snapshot, does not by itself give growth stocks a clean macro offset. The tape is telling us that a single strong narrative is no longer enough when the rate backdrop is still restrictive.
What Is Known at $232.41, and What Is Missing?
The hard facts are narrow: AMZN is -5.0807% at $232.41, the timestamp is 11:28 AM ET on July 23, 2026, the severity tag is high, and the catalyst label links Alphabet earnings to Nvidia’s lack of expected rally, per the live breaking feed. Everything else needs confirmation.
Confirmed item
Read-through
AMZN -5.0807% to $232.41, per the live breaking feed
Immediate selling pressure is confirmed in Amazon, not inferred from an index move.
VIX 16.6 versus 20-day average of 16.8, per FRED data
Broad volatility has not confirmed a market-wide stress event.
10Y Treasury 4.63% with five-day change of +8 bp, per FRED data
Higher yield pressure limits the room for growth multiple expansion.
DXY 120.53 with five-day move of -0.17%, per FRED data
The alert is not mainly explained by a sharp dollar surge.
Missing: Nvidia quote, Alphabet earnings line items, sector performance, and S&P 500 technical level
The broader AI and index message is tentative until those data points arrive.
What the tape is not pricing yet is the possibility that the absence of a volatility spike is itself the signal. If Alphabet earnings had produced a clean market-wide fear trade, VIX would likely be the first cross-asset confirmation to check. Instead, VIX is 16.6 against a 16.8 20-day average, per FRED data, which points to selective punishment rather than forced de-risking.
Where consensus can get this wrong is by treating the Nvidia question as a binary answer on AI demand. The supplied alert does not give enough data to say AI demand is weak, and it does not give enough data to say Alphabet’s print was good or bad in detail. The stronger claim is narrower: the market expected a cleaner halo, did not get it immediately, and AMZN is paying the price at $232.41.
That distinction matters for the next U.S. session path. If AMZN weakness spreads to other mega-cap growth stocks while VIX rises above its 20-day average of 16.8, the alert becomes broader. If AMZN stays weak but VIX remains near 16.6 and rates do not push beyond the 4.63% 10Y reference, the event remains a high-profile single-name repricing.
Bull/Base/Bear: AMZN at $232.41 After the Jul 23 Alert
Scenario work is useful here only if it admits what is missing. The supplied data gives a current AMZN price, a percentage decline, macro levels, and volatility context. It does not give intraday AMZN support, S&P 500 support or resistance, Nvidia’s real-time move, or Alphabet’s earnings details.
Bull: AMZN reduces the supplied -5.0807% loss and trades back toward the calculated pre-alert reference of about $244.85 during the July 23 cash session. That level is derived from the live feed’s $232.41 price and -5.0807% move, implying roughly +5.4% back to the pre-move reference.
Base: AMZN stabilizes near $232.41 while VIX stays near 16.6 versus its 16.8 20-day average, per FRED data. That keeps the alert in single-stock repricing territory unless index and sector data confirm broader pressure.
Bear: AMZN fails to hold $232.41 and the loss deepens beyond the supplied -5.0807%, per the live breaking feed. A lower AMZN technical level and the required S&P 500 support/resistance level were not supplied, so assigning a precise downside target beyond that break would invent data.
The asymmetry is not clean because the upside reference can be calculated from the supplied move, while the downside support cannot. That is exactly why traders should not overread the first print. The alert is actionable as a risk signal, but incomplete as a full-market map.
Worth noting: sticky CPI reduces the value of waiting for a rate-cut rescue. With CPI YoY at 3.7% and Fed funds at 3.63%, per FRED data, the macro regime does not give mega-cap growth stocks much room for sloppy confirmation. AMZN needs either price stabilization above $232.41 or a cleaner read-through from Nvidia and Alphabet before the market can treat this as contained.
What to Watch: AMZN $232.41 and Missing S&P 500 Support
Watch whether AMZN holds near $232.41 after the 11:28 AM ET -5.0807% print, per the live breaking feed
Key level: S&P 500 support/resistance was not supplied in today’s technical snapshot; the exact equity level available is AMZN at $232.41
If AMZN weakness spreads while VIX stays near 16.6 then the first message is selective mega-cap repricing rather than confirmed index stress, per FRED data
Trigger: No next hard catalyst time was supplied for the Alphabet earnings read-through; confirmation needs a live Nvidia quote, Alphabet earnings detail, and updated S&P 500 technical level
Next Session Watchpoints
Volume profile: Watch whether AMZN keeps at least follow-through volume versus normal.
Key level to watch: Use the nearest recent S&P 500 support/resistance level from today’s technical snapshot. is the pivot for continuation.
Catalyst quality: The move needs follow-through headlines or clean price acceptance above the pivot.
Risk trigger: If AMZN loses the opening range quickly, the move shifts from continuation to fade risk.
Frequently Asked Questions
Why is AMZN down 5.1% on July 23, 2026?
AMZN was marked -5.0807% to $232.41 at 11:28 AM ET on July 23, 2026, per the live breaking feed. The alert ties the move to Alphabet earnings and the question of why Nvidia stock is not rallying as expected, but the supplied data does not include Alphabet earnings line items or Nvidia’s exact move.
What does Nvidia not rallying after Alphabet earnings mean for AMZN?
The alert frames Nvidia’s muted reaction as a failed AI halo trade, while AMZN is the confirmed decliner at $232.41, per the live feed. Without a live Nvidia percentage move or Alphabet revenue, EPS, cloud, or capex figures, the clean read is positioning pressure rather than a final verdict on AI demand.
Which macro levels matter after the AMZN $232.41 alert?
The 10Y Treasury is 4.63% after a five-day +8 bp move, the 2Y Treasury is 4.26%, and the 10Y-2Y spread is +0.37 percentage point, per FRED data. VIX at 16.6 versus a 20-day average of 16.8 shows broad volatility has not confirmed a full-market stress move yet.
This article is for informational purposes only and does not constitute financial advice. Always do your own research before making investment decisions.