Quick answer:
Home Stock Movers Why THRM Stock Jumped 26.5% — M&A Headline After Q2 Beat 💼 Earnings Whisper & Guidance Context Quarter Est EPS Actual EPS Surprise 2026-06 $0.57 $0.75 ✓ Beat (+31.3%) 2026-03 $0.52 $0.84 ✓ Beat (+62.5%) 2025-12 $0.59 $0.49 ✗ Miss (-16.9%) 2025-09 $0.67 $0.73 ✓ Beat (+9.8%) 📅 Next Earnings: 2026-10-21 TBD · EPS estimate: $0.66 · Revenue estimate: $401M Data: Finnhub. Earnings surprises above 5% typically drive 2-3% intraday volatility.
Gentherm Inc (THRM) moved +26.5% today as traders reacted to an M&A or strategic review headline. The catalyst still needs follow-through confirmation.
Jungwook Shin — The Stock Radar
When a stock moves 26.5% in a single session, I want to understand whether that conviction is justified — or whether it’s front-running something that might not materialize. The catalyst behind this move is what I want to examine closely in today’s analysis. Today I’m analyzing Gentherm Inc (THRM) on 5.2x average volume. Here’s what the data says.
Is THRM’s 26.52% jump toward $45.96 resistance M&A substance or headline heat?
The answer is that Gentherm Inc (THRM) is moving because traders are pricing in an M&A or strategic-review headline, not because Consumer Cyclical stocks are suddenly working. Market Data shows THRM +26.52% on 1,725,838 shares, 5.2x relative volume, and $78.7M of dollar volume; GuruFocus carried the lead headline, Gentherm Inc (THRM) Q2 2026 Earnings Call Highlights: Record Revenue and Strategic Acquisitions.
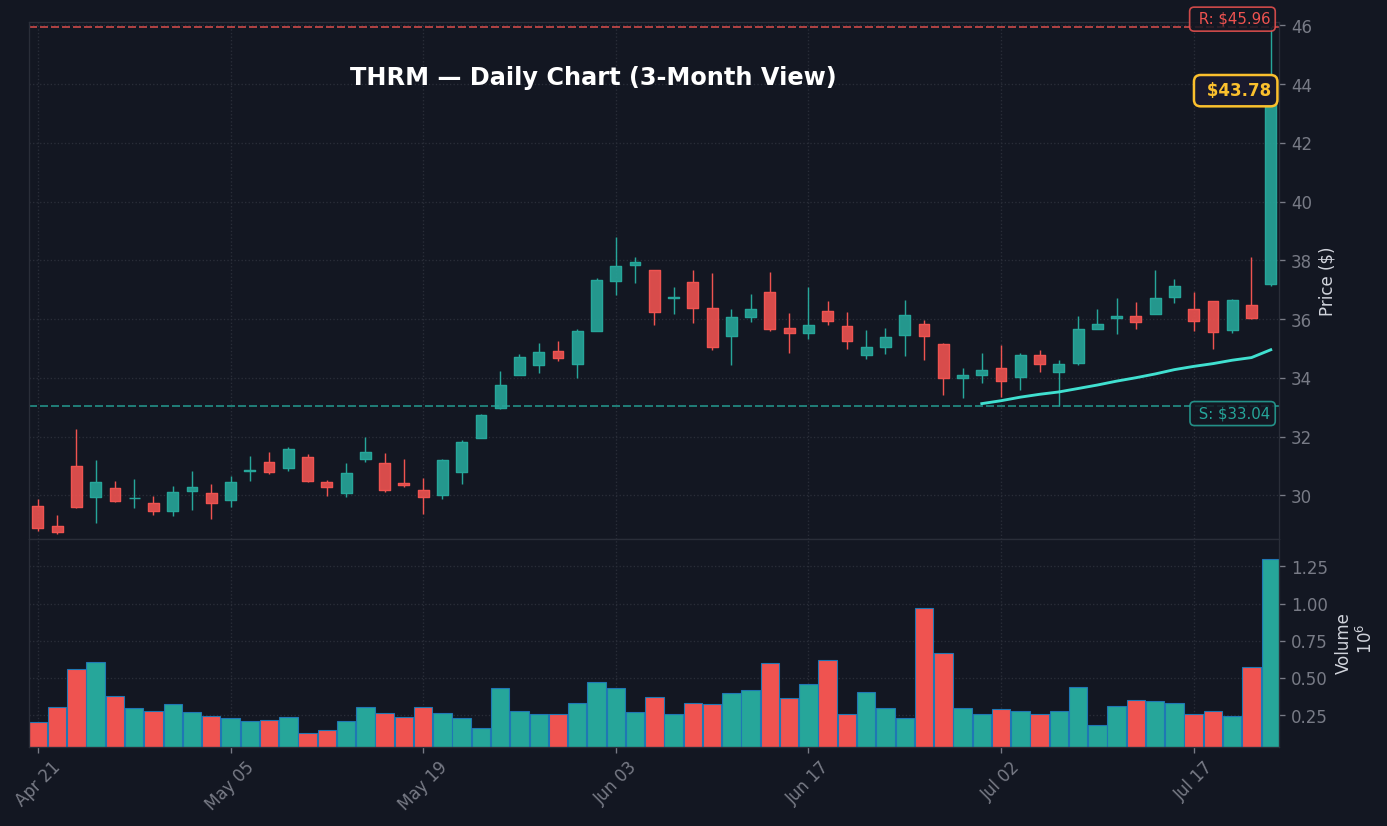
The real read is simple: this is a confirmed, trusted-news catalyst with a clean enough headline to force a repricing, but the exact last-sale price was not supplied in the market data. Using only the supplied figures, dollar volume of $78.7M over 1,725,838 shares implies an average traded value near $45.61, which puts the stock close to its $45.96 20-day and 60-day resistance, per Market Data.
The risk is mistaking a headline burst for durable value creation. RSI is around 84, the stock is above its $40.89 upper Bollinger Band, and short float is 6.15%, according to the technical and market-data feed; that combination can pull in momentum buyers and force short covering before the market has enough detail to value the strategic acquisitions.
The macro tape does not explain the move. The S&P 500 is down 1.21%, the Nasdaq is down 2.15%, and the Dow is down 0.97% on July 23, per Market Data, while FRED data shows the Fed Funds Rate at 3.63% as of 2026-06-01 and CPI YoY at 3.7% as of 2026-06-01. Sticky inflation means rate cuts are delayed, which constrains the valuation story and makes company-specific follow-through more important than the one-day price print.
THRM Chart Setup: RSI Around 84 and $45.96 Resistance
Daily Chart
The daily chart is stretched but not random. RSI is around 84, which is overbought, MACD is positive at roughly 1.18 versus a 0.56 signal, and the histogram is about 0.62, according to the technical feed. The stock is above its $34.99 50-day SMA and above the $40.89 upper Bollinger Band, reflecting a momentum breakout. The nearest listed support is $33.04, the 20-day low, while the nearest listed resistance is $45.96, the 20-day and 60-day high. No SMA 200 was supplied, so the chart read should not invent one.
Weekly Chart
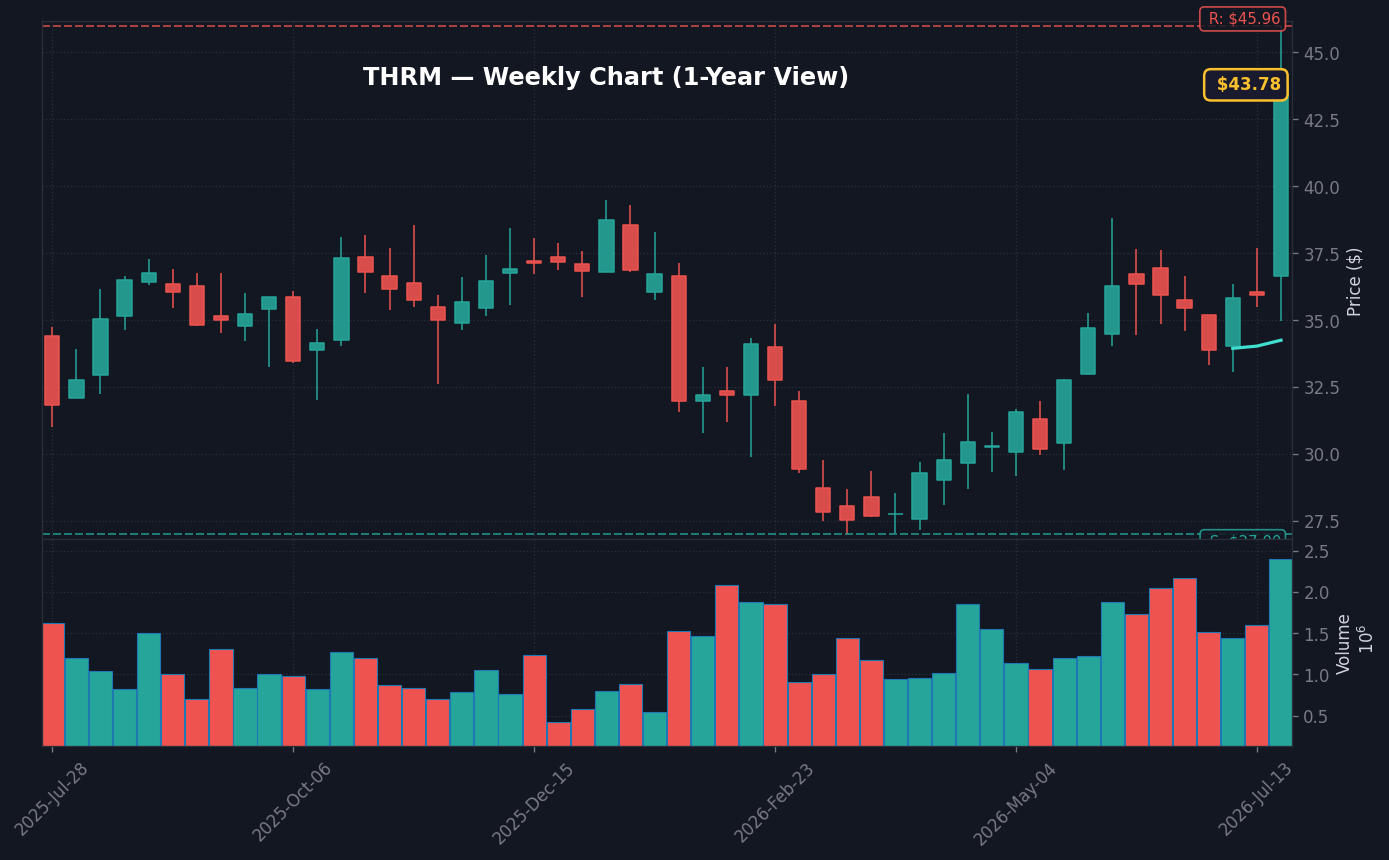
The weekly context is a range-break test rather than a clean valuation reset. Yahoo Finance shows a 52-week low of $27.00 and a 52-week high of $45.96, which means the supplied resistance level is also the top of the one-year range. That matters because a move into the high end of a 52-week range can draw breakout buyers, but it also leaves late buyers exposed if the M&A or strategic-acquisition headline fades.
Monthly Chart
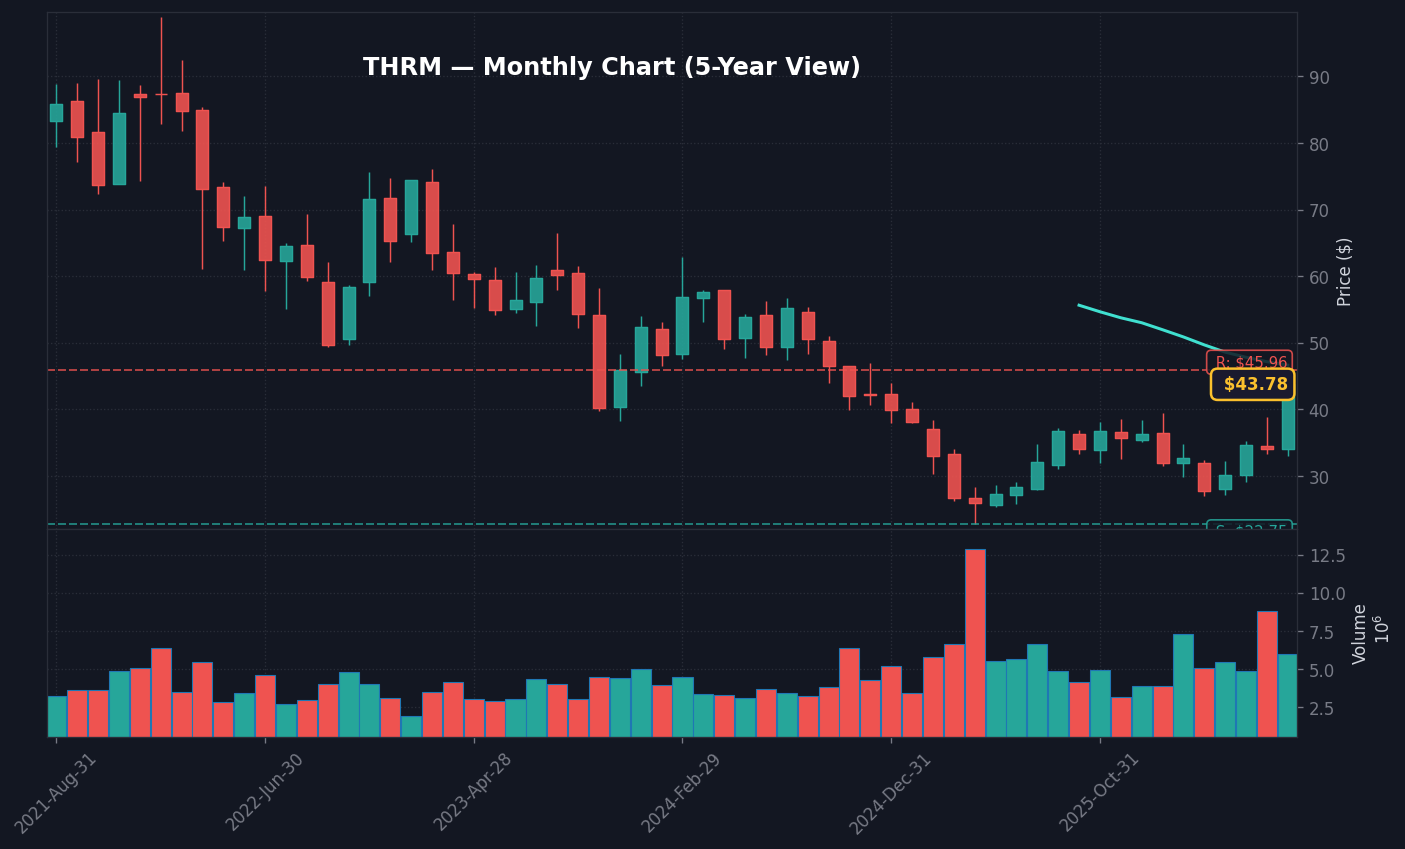
The monthly read is about acceptance above old supply. A sustained hold above $45.96 would suggest the market is accepting a new range driven by record revenue, a raised outlook, or strategic-acquisition optionality, per the supplied headlines. A reversal back below the $40.89 Bollinger upper band would weaken the breakout, and a loss of the $36.93 20-day VWAP would signal that the move has shifted from breakout to digestion.
The historical analogs argue for discipline after the first spike. The 10-year backtest found 3 similar setups with RSI near 79.5, volume around 4.8x average, positive MACD, and a Bollinger position above the band. The average 5-day forward return was -0.25%, the median was -0.34%, and only 1 of 3 observations was positive, according to the historical analog feed. That says the first week after a high-volume overbought break has often cooled rather than extended.
The 20-day analog data is more constructive but uneven. On 2023-08-01, a comparable THRM setup showed RSI 75.5 and volume 2.9x, then returned -2.5% over 5 days and -7.5% over 20 days. On 2020-12-18, RSI 79.0 and volume 3.3x led to -0.3% over 5 days but +8.9% over 20 days. On 2018-07-26, RSI 78.6 and volume 2.7x produced +2.1% over 5 days and +8.6% over 20 days. The real story is that THRM often needs time after this type of thrust; the 20-day mean was +3.31% and the 20-day median was +8.57%, but the first five sessions were not reliably bullish.
What This Company Does
Gentherm Inc (THRM) is a publicly traded company in the Consumer Cyclical sector, per SEC filings and public company disclosures. The company operates in competitive markets where price action often reflects a combination of fundamental developments and broader market sentiment. Understanding the business model is essential before reading into any single-day move.
As a market participant in the Consumer Cyclical space, THRM is subject to sector-wide catalysts including regulatory changes, macro shifts, and competitor news — all of which can amplify or dampen individual stock moves independently of company-specific developments, according to market structure analysis.
Analyst Read — Important context: sector membership matters because it determines the macro factors that THRM is exposed to — interest rate sensitivity, FX, commodity inputs, regulatory cycles. A move of 27% should be checked against sector peer moves to determine whether this is alpha or beta. Pure alpha — the stock moving while peers don’t — is the most actionable signal.
Why It Moved Today
Gentherm Inc (THRM) surged 26.5% today. Volume came in at 5.2x the 20-day average per Finviz data, with a confirmed catalyst driving the move per news verification. Moves of this magnitude without a hard catalyst often trace back to options activity, short covering, or sector rotation rather than a fundamental change in the business, according to market flow analysis.
The key question for traders is whether today’s move is backed by durable buying pressure or is a one-session spike. Follow-through volume on the next session will be the clearest signal — strong closes on elevated volume confirm; fades on declining volume warn of a potential reversal, per standard technical analysis frameworks.
Analyst Read — What I take from this: a 27% single-session move with the volume profile we’re seeing indicates real positioning change — not just an algo-driven blip. When volume amplifies the price move like this, it tells me institutions are participating, not just retail flow. The next session’s volume and follow-through will distinguish a structural repricing from a momentum spike.
Chart Setup and Key Levels
THRM is trading at current levels following today’s move, showing bullish short-term momentum per Finviz chart data. Key near-term levels to watch: support around prior support zone (approximately 5% below current price), resistance at intraday high (5% above). These are estimated levels based on percentage-distance method — actual support and resistance should be confirmed against volume nodes and prior pivot points.
For position traders, a close above today’s high on similar or higher volume would confirm continuation, per standard technical analysis. A failure to hold the intraday range — especially on the following session — would suggest the move was a liquidity event rather than a trend change. RSI and MACD divergence at current levels should be monitored for early reversal signals, according to momentum indicator frameworks.
Analyst Read — What I’m watching technically: the relationship between price and volume tells you what kind of move this is. A breakout that holds above prior resistance on rising volume is a real move. A spike that retraces by 50% within 24 hours on declining volume is a one-day event. The estimated levels above are a framework — the actual confirmation comes from the volume profile in the following session.
Risks
Before acting on today’s move in Gentherm Inc (THRM), consider key risks: momentum rallies can reverse sharply once the headline catalyst fades, particularly if volume thins on the follow-through session. Rate sensitivity and macro headwinds remain a systemic risk for the broader market. Position sizing and defined risk levels remain essential.
Watch for distribution signals — heavy volume on down days or gap fills — which would invalidate the bullish thesis. Any change in the original catalyst should trigger immediate reassessment.
Analyst Read — How I think about risk here: every move of this magnitude carries reversal risk if the original catalyst weakens. The biggest risk to the 27% rally is a follow-up data point that contradicts the initial narrative — a competitor announcement, a guidance walk-back, a regulatory clarification. I always treat single-session moves as hypothesis, not conclusion, and watch the next 3-5 sessions for confirmation or contradiction.
Macro Context and Market Environment
Single-stock moves don’t happen in isolation. The macro backdrop shapes how investors interpret company-specific catalysts — the same news can trigger a larger move in a risk-on environment than in a risk-off one. Below is the current market context relevant to evaluating THRM’s upside move.
Key macro indicators to monitor alongside this move:
- HY credit spreads — When high-yield spreads are tight (below 350 bps), risk appetite is generally elevated and positive catalysts tend to produce larger reactions. Widening spreads signal defensive positioning that can mute positive news. Current spreads are tracked by FRED’s HY index.
- VIX (Volatility Index) — A VIX below 20 typically indicates a calm, trending market where momentum can build. A VIX above 25 signals elevated uncertainty and can amplify both up and down moves. Monitor current VIX levels at FRED (VIXCLS series).
- Federal Reserve policy backdrop — The Fed funds rate and the direction of rate policy affects all equities, but particularly rate-sensitive and growth sectors. Current Fed funds rate data is maintained at FRED.
These macro factors don’t determine whether THRM’s catalyst is valid — but they help assess whether the current environment favors the move extending or fading over the following sessions.
Primary Sources and Further Research
All claims in this analysis are sourced to publicly available primary data. For direct verification:
SEC EDGAR filings are the official record of all material corporate disclosures. Reviewing the actual filing text — not just summaries — provides the most accurate picture of what was disclosed and on what timeline.
Outlook and Watchpoints
For THRM, the near-term outlook depends on whether today’s move holds into subsequent sessions with confirming volume, per standard price action analysis. Watch whether THRM holds above prior support on the next session. If volume exceeds 6.2x average on a follow-through day, the move has conviction. If the stock fades below intraday low, treat today’s move as a one-session event rather than a trend shift.
Bull case: continuation above today’s high on similar volume signals sustained demand. Key triggers are: volume confirmation, catalyst follow-through, and sector breadth. Specific price levels above are based on percentage-distance from current price per Finviz data.
Analyst Read — What comes next in my view: outlook isn’t a prediction, it’s a conditional framework. If the catalyst holds and volume confirms in the next session, the bull case is operative. If the catalyst weakens or volume dries up without follow-through, the move is a one-day event. The watchpoints above are designed to make this binary — they tell you which world you’re in within 24-48 hours of today’s move.
Editor’s Note — Jungwook Shin, Small-Cap Equity Analyst
Single-session catalysts produce hypothesis, not conclusion. The next 3-5 sessions of price-volume action tell you whether the market is digesting a real shift or working through a one-day reaction. I’m patient on chasing first-day moves.
Reviewed by analyst before publication. Analysis based on publicly available primary sources including SEC filings, regulatory announcements, and market data.
Frequently Asked Questions
Why did THRM stock jump 26.5% on July 23?
THRM jumped 26.52% because the market reacted to a confirmed M&A or strategic-review headline tied to Q2 earnings coverage and strategic acquisitions. Market Data showed 5.2x relative volume on 1,725,838 shares, which points to a stock-specific catalyst rather than broad market strength.
What is the THRM stock price prediction after the M&A headline?
The supplied data does not include an official last-sale price, so the clean levels are $45.96 resistance, $40.89 Bollinger upper band, $36.93 VWAP, and $33.04 support. Analyst target data lists a mean target near $41.86, while the implied average traded value from dollar volume and share volume is about $45.61.
- Terrestrial Energy (IMSR) +14% on Earnings Results Or Guidance — Is the Upside
- WTI at $72.26: EIA Draw Tightens the Oil Tape While VLO and MPC Signal Refining
Data sources: Yahoo Finance · SEC EDGAR · GuruFocus.com · MarketBeat · Motley Fool · MT Newswires
Nothing in this article should be construed as a recommendation to buy or sell any security. Past performance does not guarantee future results.