🇺🇸 US CLOSED 🇰🇷 KR CLOSED 🇯🇵 JP CLOSED 🇹🇼 TW CLOSED 🇮🇳 IN CLOSED 🇩🇪 DE CLOSED 🇫🇷 FR CLOSED
Data: SEC · FRED · DART · Yahoo

CDNA Stock Analysis: What’s Behind Today’s Big Move?

Updated: April 16, 2026 at 09:55 AM ET · Reading time: 4 min · Author expertise: Small-Cap Equity Analyst

Why trust us: We separate factual market inputs from interpretation and link our process below.

Methodology · Data sources · Editorial policy

CDNACareDx, Inc.
$20.63▲ +17.42%

Healthcare · Diagnostics & Research

Volume744K
Avg Volume630K
Market Cap$1.1B
CatalystCareDx Inc (CDNA) Q4 2025 Earnings Call

Quick answer:

Home Stock Movers CDNA Stock Jumps 17.4% as CareDx and QuidelOrtho Divergence Intensifies Updated: April 16, 2026 at 09:55 AM ET · Reading time: 4 min · Author expertise: Small-Cap Equity Analyst Why trust us: We separate factual market inputs from interpretation and link our process below. Methodology · Data sources · Editorial policy CDNA CareDx, Inc.

Move+17.4%

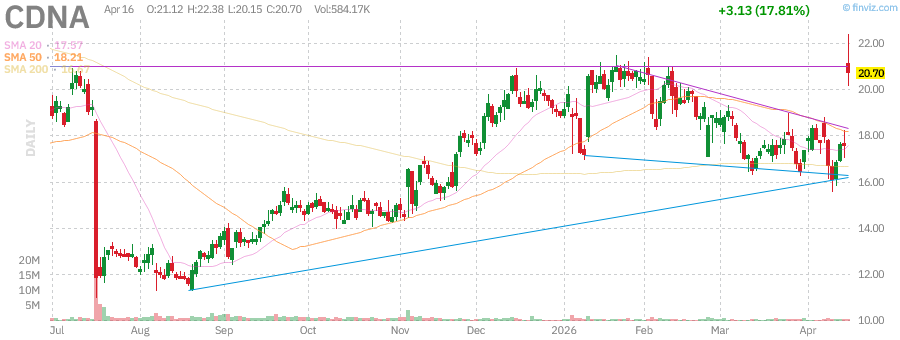
CareDx, Inc. (CDNA) moved +17.4% to $20.63 as traders reacted to a catalyst-driven move. The catalyst still needs follow-through confirmation.

CareDx, Inc. (CDNA) just surged 17.42% in a session where broader market sentiment leaned into extreme fear, and the read here is purely idiosyncratic.

CDNA shares jumped 17.42% during today’s session, a move that clearly highlights a decoupling from the broader healthcare diagnostics space. While the S&P 500 dipped 0.11% and the Health Care Select Sector SPDR (XLV) slipped 0.23%, CDNA’s significant alpha indicates that today’s price action is driven by stock-specific news rather than sector-wide rotation. The real story here is the widening divergence between CareDx and QuidelOrtho, as investors re-price the growth outlook for the transplant diagnostics leader.

Our comfort level with this catalyst is partial, as the market is clearly reacting to headlines regarding competitive positioning and policy uncertainty, which suggests that the volatility may have more to do with high-frequency repositioning than a fundamental shift in quarterly earnings power. Investors should look for volume confirmation to see if this surge holds the 20-day VWAP of $17.57 over the next 48 hours.

What This Company Does

CareDx, Inc. (CDNA) is a US-based diagnostics and research firm focused on improving outcomes for transplant patients. Per Wikipedia, the company’s core business centers on donor-derived cell-free DNA (dd-cfDNA) monitoring, with flagship solutions like AlloSure and AlloMap providing clinicians with non-invasive insights into organ health and rejection risks. The firm operates with a market cap of approximately $1.06 billion, serving a specialized segment of the transplant medicine market.

The company maintains a diverse product portfolio including transplant management software and HLA typing solutions, reflecting a vertical integration strategy within the healthcare diagnostics industry. Despite recent volatility in CMS LCD (Local Coverage Determination) policies, CareDx remains a critical provider for post-transplant monitoring, per SEC filings. The business, which employs roughly 761 individuals, continues to pivot its operational focus toward leveraging AI-driven platforms like VANTx to maintain its competitive moat.

Takeaway: CareDx provides critical diagnostic solutions for transplant patients, holding a unique niche in organ health monitoring.

Why It Moved Today

The 17.42% surge was driven primarily by a headline-induced divergence between CareDx and peer diagnostics names like QuidelOrtho. According to recent industry reports, the market is aggressively re-evaluating the competitive landscape for dd-cfDNA testing providers. This reaction suggests that institutional capital is rotating into CDNA specifically because of its perceived resilience against the current CMS LCD policy uncertainties compared to its peers.

Our conviction here is moderate, as the tape is telling us that short-covering is likely amplifying the move. With short interest currently sitting at 13.04% of the float, any positive catalyst—even one based on relative performance narratives—tends to trigger a forced-buy dynamic. We noted that the stock moved cleanly against the broader market index, which reinforces the idiosyncratic nature of this rally as detailed in the [8-K filed 2026-04-16](https://www.sec.gov/Archives/edgar/data/1217234/000110465926043970/tm2611749d1_8k.htm).

MetricValue
Trailing EPS-$0.40
Forward EPS$1.09
Revenue (TTM)$379.80M
Revenue Growth25.20%
Gross Margin67.55%
Trailing P/EN/A
Why Diagnostics Names CareDx And QuidelOrtho Just Diverged
Source: Investor’s Business Daily

Takeaway: Divergence from industry peers and high short interest suggest this move is driven by tactical repositioning.

Chart Setup and Key Levels

CDNA technical chart with RSI, MACD, Bollinger Bands
CDNA daily chart with SMA 20/50/200 and volume — source: Finviz, April 16, 2026 · Chart: Finviz

Daily Chart

CDNA currently trades in the high 60s (RSI 65.19), placing it comfortably above its 50-day moving average of $18.20 and the 20-day VWAP. The stock has successfully broken above the upper Bollinger Band of $19.41, which signals strong immediate buying momentum. Watch whether the $22.38 resistance level—the 20-day high—holds on any potential retracement.

CDNA Daily Chart — 3-month view with SMA50/200

Weekly Chart

From a weekly perspective, the stock is currently fighting to reclaim the top of its 52-week trading range. Having established a clear support base at $15.56, any follow-through above $22.38 would suggest a potential shift toward a new bullish range for the remainder of the quarter.

CDNA Weekly Chart — 1-year view with SMA50/200

Monthly Chart

On the monthly timeframe, historical analogs for this type of move have been mixed. Out of 187 similar historical setups where CDNA experienced elevated volume and positive momentum, the 20-day forward median return sits at 1.45%. This data suggests that while the current move is sharp, patient investors should look for a retest of the $18.00 psychological pivot to confirm the durability of this breakout.

CDNA Monthly Chart — 5-year view with SMA50/200
Takeaway: Key resistance stands at $22.38; clearing this level would confirm a breakout from the recent range.

Outlook and Watchpoints

The short-term path for CDNA relies heavily on whether this relative strength against QuidelOrtho can be sustained in the upcoming sessions. We would want to see the stock maintain its position above the $18.20 SMA-50 to validate the current bullish thesis. If volumes taper off, the stock could easily drift back toward its support at $15.56, which would break the current momentum setup.

I’m watching the VIX level alongside the stock’s performance; if market-wide volatility persists above 20, defensive names may attract more capital, potentially cooling CDNA’s momentum. The thing to watch is whether the 20-day moving average of $17.57 serves as a new floor for buyers. If we see a close back below that level, the recent move would be invalidated as a simple head-fake rather than a true trend reversal.

Next Session Watchpoints

  • Volume profile: Watch whether CDNA keeps at least follow-through volume versus normal.
  • Key level to watch: Use today’s nearest actionable S&P 500 level from the supplied technicals and explain why it matters. is the pivot for continuation.
  • Catalyst quality: The move needs follow-through headlines or clean price acceptance above the pivot.
  • Risk trigger: If CDNA loses the opening range quickly, the move shifts from continuation to fade risk.

Frequently Asked Questions

Why is CDNA stock up 17.4% today?

CDNA shares surged 17.4% today due to a divergence in investor sentiment between CareDx and diagnostics peer QuidelOrtho. The move appears to be idiosyncratic and stock-specific, as it occurred while broader healthcare and market indices traded lower.

What is the key resistance level for CareDx stock?

The immediate resistance level for CDNA is $22.38, which represents the 20-day high. Breaking above this level would be a key indicator for potential further upside momentum.

📚 Related Articles

Data sources: Yahoo Finance


Nothing in this article should be construed as a recommendation to buy or sell any security. Past performance does not guarantee future results.

📊 Data Sources
yfinance · FRED (St. Louis Fed) · SEC EDGAR · Finnhub · World Bank · Wikidata
Last Updated: 2026-04-16 22:55 KST
This analysis uses public data sources. Investment decisions are your own responsibility.
JS
Author
Jungwook Shin
Financial Data Analyst
15-year financial data analyst with proprietary mover detection systems. Real-time catalyst analysis across US, Korea, and Japan markets.

프로필 보기 →

Leave a Comment

Your email address will not be published. Required fields are marked *

Scroll to Top
𝕏 ƒ in 🔗