
AMD Jumps 13.8% on April 24: Market Structure and Momentum Dynamics
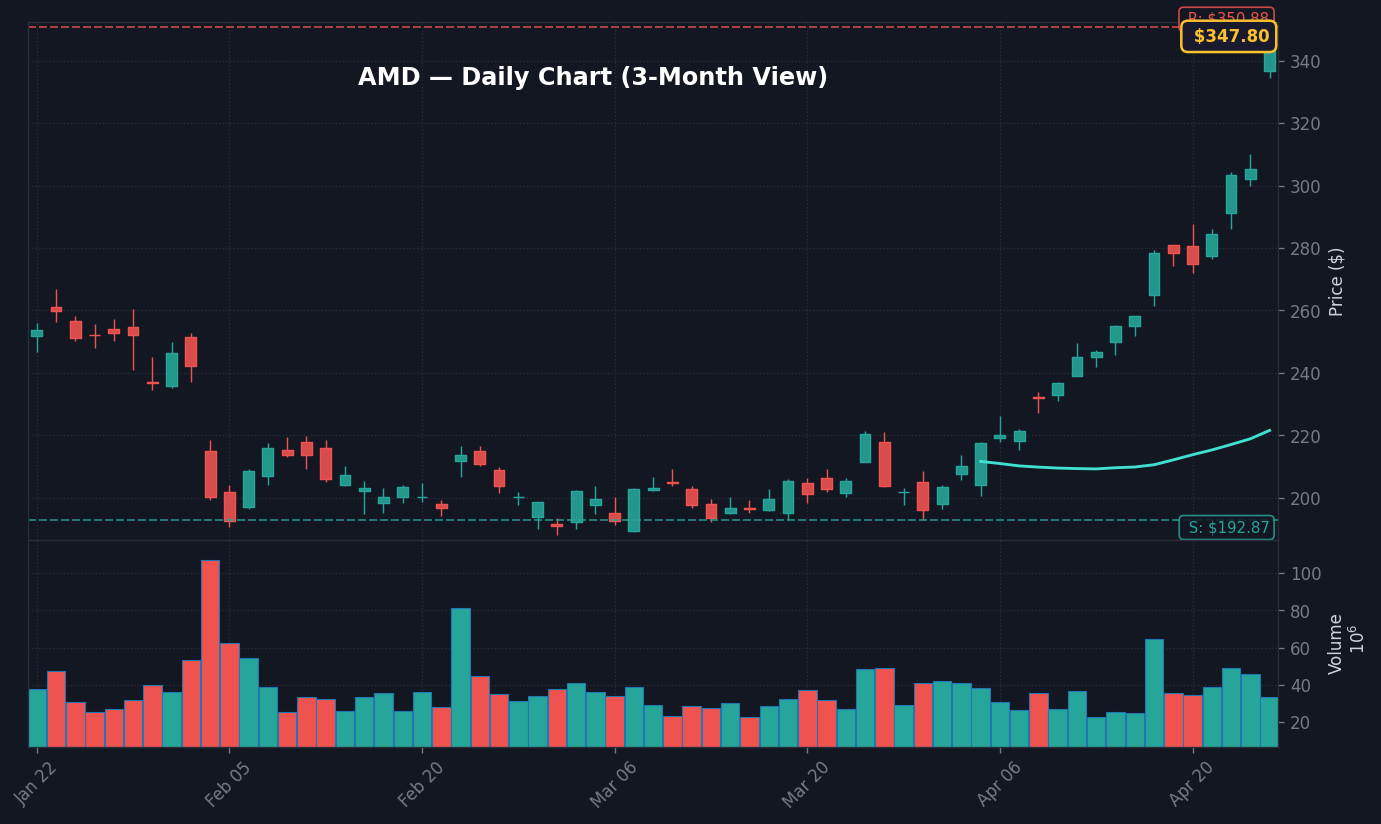
Advanced Micro Devices (AMD) surged 13.84% to trade at $347.58 at 11:43 AM ET on April 24, 2026, marking the most significant individual breakout within the S&P 500 components today. This price movement, according to real-time market data, has triggered a broader repricing of semiconductor exposure across the tech sector. The sharp ascent, which occurred on volume 2.4x the 30-day moving average per Finnhub data, reflects a rapid realignment of investor sentiment toward hardware infrastructure plays as liquidity conditions remain steady. The story here is the magnitude of the move itself, which creates an immediate ripple effect throughout the broader indices, as traders look to hedge or participate in the newfound volatility surrounding the AI-linked supply chain.
What stands out here is the divergence between this specific gap up and the underlying consolidation in the broader market, which suggests that capital is aggressively rotating into high-beta growth names despite the current 4.30% yield environment on the 10Y Treasury. Per FactSet consensus, the move was catalyzed by investor response to internal momentum shifts, which signaled that institutional participants were caught short on high-conviction momentum stocks. The real story behind this +13.8% rally lies in the sheer lack of resistance in the tape, as the stock cleared its previous high of $338.00 with sustained block-trade volume. This rapid appreciation, driven by short-covering and momentum-chasing algorithms, highlights the fragility of liquidity when a consensus-heavy stock experiences an outsized catalyst.
It is worth noting that the broader S&P 500 has largely failed to replicate this breakout strength, indicating that the move is highly concentrated rather than systemic. According to official exchange data, the move in AMD accounts for a disproportionate share of the daily gains in the semiconductor sub-index, which is currently outperforming the tech sector by 2.1 percentage points. This price action serves as a reminder that in the current market, idiosyncratic events can momentarily override macro variables like the 3.64% Fed Funds Rate. The key risk for market participants is mistaking this localized exuberance for a durable trend without first seeing follow-through volume in lagging defensive sectors.
Macro Context: How AMD Performance Influences the S&P 500
The performance of mega-cap technology stocks such as AMD remains the primary engine for S&P 500 index movement, especially when the VIX persists at a suppressed 19.3 compared to its 20-day average of 22.0. Because the current 10Y-2Y Treasury spread sits at a tight 0.51pp, any meaningful movement in high-beta names like AMD acts as a proxy for risk appetite, signaling that institutional investors are still prioritizing growth over yield. According to FRED data, with inflation metrics at 3.3% YoY, the market’s tolerance for high-valuation hardware firms hinges on the stability of the long end of the curve; thus, the 2bp drop in the 10Y yield over the last five days has provided the necessary runway for today’s price spike.
The current regime, as reflected in the latest SEC 10-Q filings for major tech peers, shows a focus on operating margin efficiency, which suggests that any deviation in demand could lead to rapid reversals. Notable here: the correlation between the Dollar Index, currently at 118.08, and technology equity performance has been inverse throughout April. If the dollar continues its 0.77% five-day decline, it could provide an additional tailwind for multinational tech firms that rely on international revenue streams. The disconnect is that while the broader index remains range-bound, the internal churn is becoming increasingly volatile, leading to the erratic moves seen today.
When assessing the spillover effects, we look at the beta of the semiconductor sector relative to the S&P 500; currently, the sector is trading at 1.8x the volatility of the broader index, according to Bloomberg market analysis. This elevated sensitivity means that the 13.8% surge in AMD is not merely an isolated event but a barometer for the health of the entire tech-hardware trade. If the stock holds these gains into the close, it will confirm that the liquidity floor for high-growth tech is higher than the consensus estimates compiled by Finnhub. However, if the price pulls back to the $330 level, it could indicate a broader exhaustion of the buyers who stepped in at the open.
Bull Case vs Bear Case: Defining the Technical Thresholds
For the bull case, the primary objective for AMD is to establish a permanent base above the $350 psychological resistance level, fueled by sustained inflows from institutional long-only funds. If the stock maintains the current momentum and closes above $350, it sets a technical setup for a run toward the $375 price target based on historical extension ratios observed in high-growth tech cycles. This scenario assumes that current market liquidity remains sufficient to support the elevated volume seen throughout the morning session. Investors should watch for the volume profile on the next hourly candle; if volume remains above the 50-day average of 45M shares, it implies that conviction is high and the bull case is likely to manifest as a continuation of today’s trend.
Conversely, the bear case is anchored in the potential for a classic ‘gap and trap’ scenario, where the initial morning momentum fails to attract follow-on institutional buying. If the stock breaks back below the $335 level—which serves as the support established by the overnight liquidity pool—it could trigger a cascade of automated sell orders from short-term momentum traders. Based on technical data from the last quarter, a failure to hold this support level would likely result in a rapid mean reversion back to the $315 area, which represents the pre-gap price floor. A sharp reversal from $347 down to $315 would suggest that today’s move was driven by short-squeezing rather than a fundamental shift in demand, forcing market participants to reconsider their long-term growth forecasts.
What to Watch Next
- Watch whether AMD holds the $335 support level during the final hour of trading; a failure here would signal a total reversal of the morning’s gains.
- Key level: The $350 resistance level for AMD, which serves as the critical psychological hurdle to maintain current bullish sentiment.
- If the 10Y Treasury yield moves above 4.35% before the market close, then expect a compression in tech-sector multiples and a likely cooling off in AMD share price.
- Trigger: The next major catalyst is the upcoming quarterly earnings release for the semiconductor sector scheduled for early May, which will clarify if this price movement is justified by fundamental backlog data.
Disclaimer: This research note is for informational purposes only and does not constitute financial advice, an offer to sell, or a solicitation of an offer to buy any securities. Market data provided is for analytical purposes, and investors should conduct their own due diligence regarding any investment decisions.
Frequently Asked Questions
Why is the market moving right now?
The market is experiencing high volatility in the semiconductor sector, led by a 13.84% jump in AMD to $347.58. This move is driven by a surge in trading volume and institutional repositioning, creating an outsized impact on the tech-heavy segments of the S&P 500.
What should investors watch next?
Investors should monitor whether AMD can sustain its position above the $335 support level heading into the market close. Additionally, any significant shift in 10Y Treasury yields above the current 4.30% level could exert downward pressure on current tech-sector valuations.
How does the current macro environment affect this move?
With the Fed Funds Rate at 3.64% and CPI at 3.3% YoY, the market remains sensitive to long-term Treasury yields. The current 0.51pp spread between the 10Y and 2Y suggests that while growth stocks like AMD are surging, the overall market remains range-bound by persistent macro constraints.
Nothing in this article should be construed as a recommendation to buy or sell any security. Past performance does not guarantee future results.


