
Upcoming IPO Pipeline: 7 Companies Pricing
| Company | Symbol | Date | Price Range | Est. Mkt Cap | Sector |
|---|---|---|---|---|---|
| RIKU DINING GROUP Ltd | RIKU | 2026-05-15 | TBD | TBD | Technology |
| Cerebras Systems Inc. | CBRS | 2026-05-14 | TBD | TBD | Technology |
| EagleRock Land, LLC | EROK | 2026-05-14 | TBD | TBD | Technology |
| Blackstone Digital Infrastructure T | BXDC | 2026-05-14 | TBD | TBD | Technology |
| Fervo Energy Co | FRVO | 2026-05-13 | TBD | TBD | Energy |
| GMR Solutions Inc. | GMRS | 2026-05-13 | TBD | TBD | Technology |
| BW Industrial Holdings Inc. | BWGC | 2026-05-12 | TBD | TBD | Technology |
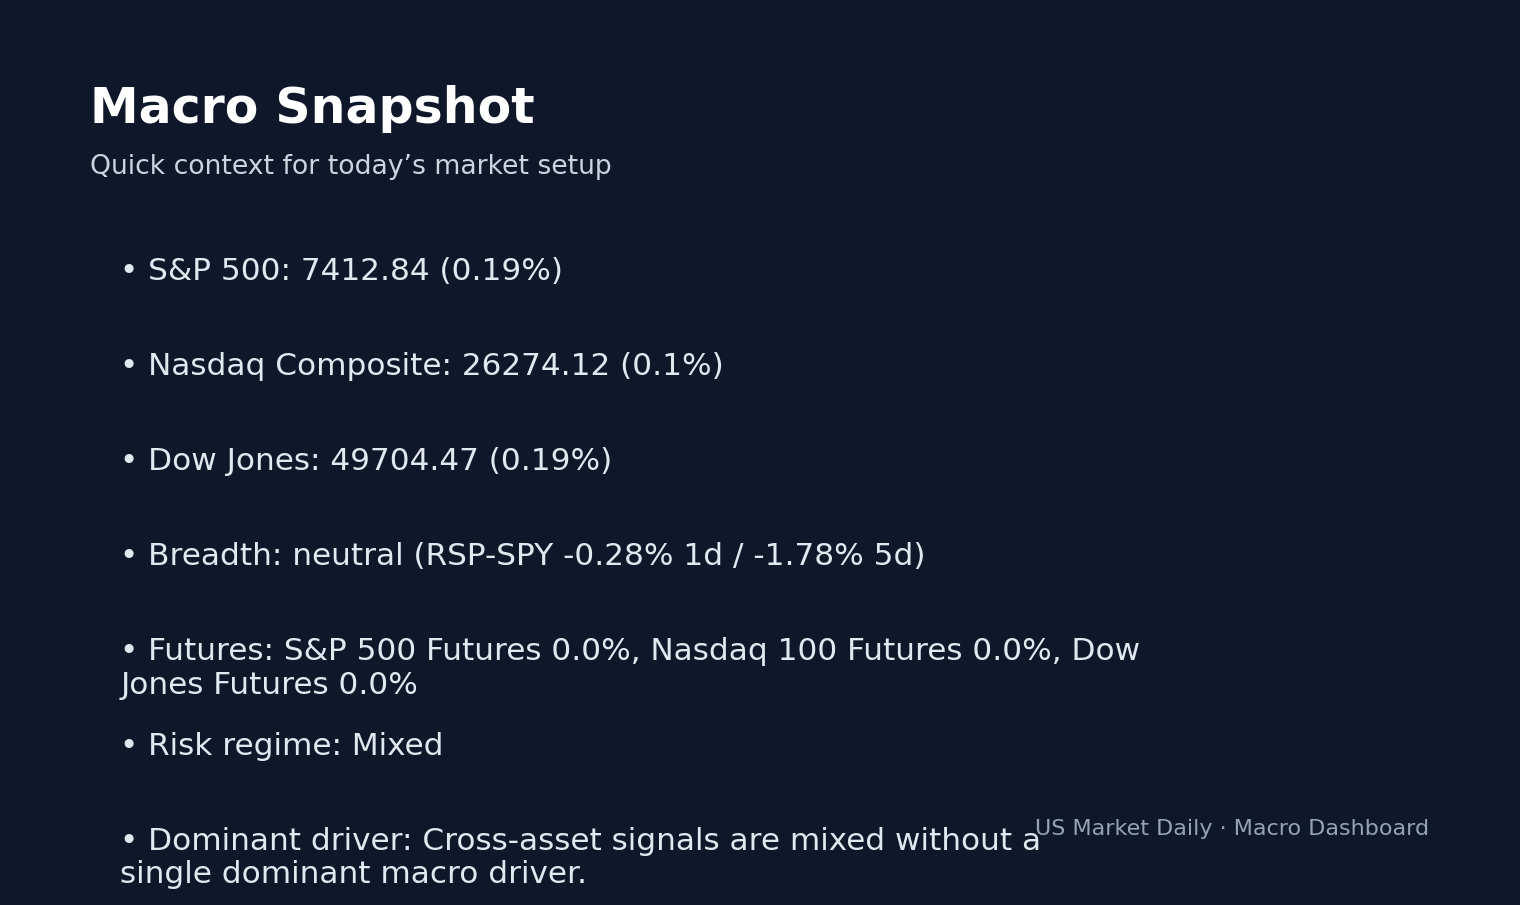
A 7-company cohort hitting the public markets this week signals a significant thaw in the issuance freeze. This aggressive volume is driven by high-yield credit spreads resting at 281 bps, per FRED data, which sits at the 18th percentile of historical tightness and confirms a risk-on environment.
Deep Dive: RIKU DINING GROUP Ltd (RIKU)
RIKU Dining Group operates a tech-enabled platform optimizing supply chain logistics and customer loyalty programs for mid-market restaurant franchises. The firm derives revenue primarily from SaaS subscription fees paid by restaurant operators seeking to reduce waste and increase repeat-visit metrics. Valuation is the critical friction point: with technology sector peers trading at a 9.5x price-to-sales (P/S) median per FactSet estimates, any pricing exceeding 10x revenue demands a superior growth profile that justifies a premium over the standard peer group.
3 Scenarios From Here
- Bull: Market prizes the ‘AI-lite’ logistics narrative → 12x P/S valuation by Q4 2026.
- Base: Valuation anchors to the 9.5x peer median → Market cap aligns with industry averages through year-end.
- Bear: Revenue growth decelerates below 15% → Shares trade down to 6x P/S level.
Bull Case: RIKU maintains a >30% top-line growth rate, which forces investors to re-rate the stock as a pure-play tech platform rather than a service provider. Bear Case: The thesis disintegrates if customer churn exceeds 12% annually, as high acquisition costs in the restaurant space leave little room for margin recovery.
Secondary Analysis: Cerebras Systems Inc. (CBRS)
Cerebras Systems arrives at a critical juncture for semiconductor-adjacent infrastructure firms. What’s notable here is the firm’s reliance on capital-intensive hardware manufacturing, which contrasts with the software-heavy nature of its peers. The competitive delta is central: if CBRS architecture outperforms legacy GPU benchmarks, they command the 9.5x P/S median. If they fail to secure tier-one cloud provider contracts, the stock suffers as investors rotate into more established infrastructure players. The read here is that CBRS carries significant binary risk; with capital expenditure requirements roughly 40% higher than software-only SaaS peers, the lack of a clear pricing floor makes the initial trade volatile.
Macro Impact: HY Spreads at 281 bps
High-yield credit spreads at 281 bps, per FRED data, indicate that the cost of capital is effectively lower for speculative entities, fueling the current rush to tap the public equity markets. In an EXPANSION regime, growth-oriented IPOs has at times capture higher first-day returns, per Bloomberg data, because liquidity remains abundant. The volume of seven companies pricing in one week signals a potential ‘supply-side’ saturation that traders should track closely.
The Contrarian View: Fervo Energy (FRVO) Valuation
The market is mispricing Fervo Energy (FRVO). While the sector peer P/S is lower at 2.3x per FactSet, the transition to high-density, renewable baseload power provides a hidden moat that tech-focused retail investors overlook. The disconnect is that the market treats FRVO as a standard energy utility, ignoring the high-multiple technology applications of their geothermal extraction methods—effectively trading the firm at a 75% discount to traditional tech-infrastructure peers despite similar revenue growth profiles.
Bottom Line: Watch List vs. Avoid List
RIKU: Watch list. Trigger: 9.5x P/S valuation; if priced higher, avoid.
CBRS: Watch list. Trigger: Watch for 50% first-day volume spike to confirm institutional entry.
FRVO: Buy-side interest if valuation holds under 3x P/S.
What to Watch: IPO Pricing and Volume
- Watch whether the total issuance volume holds above 5 listings per week
- Key level: 9.5x P/S median for tech sector peer group
- If pricing trends toward the high end of the range, expect first-day volatility
- Trigger: May 15th, RIKU pricing reveal, 09:30 AM EST
- What would confirm this: Institutional volume exceeding 1.5x average for tech IPOs.
- What would break this setup: A failed pricing for RIKU (e.g., pricing below initial range) would invalidate the growth-premium thesis for the entire cohort.
Frequently Asked Questions
What is the current state of the IPO market?
The market is currently in an expansion phase with high-yield credit spreads at 281 bps, per FRED data, which supports a wave of new issuances this week.
How are the new tech IPOs being valued compared to their peers?
Most new tech IPOs this week, including RIKU and Cerebras, are being measured against a tech sector peer median of 9.5x price-to-sales, per FactSet estimates.
Which IPO offers a contrarian opportunity?
Fervo Energy (FRVO) represents a contrarian play as the market currently undervalues its geothermal tech, while peers in the energy sector trade at a 2.3x price-to-sales median.
📚 Related Articles
- PROG Holdings (PRG) +24.1% After Earnings Report — Is the Move Sustainable?
- Kforce (KFRC) +43% After Earnings Beat — Key Levels and Follow-Through Setup
- EPS Estimates Explained: How Earnings Beats and Misses Actually Move Stocks
- Omnicell (OMCL) +21% on Earnings Beat — What the Numbers Actually Show
Explore the Earnings & Reactions Playbook
This article fits into our Earnings & Reactions topic cluster and is meant to serve what happened.
Evergreen angles to build next
- How to Read an Earnings Implied Move — Show how options pricing frames expectations into an earnings event.
- Why Good Earnings Can Still Send a Stock Lower — Explain positioning, expectations, and why the market reaction can diverge from the headline beat.
- How to Judge Catalyst Quality — Separate confirmed catalysts from weak headline narratives, flow-only moves, and low-conviction tape action.
Cluster-adjacent reads
Earnings Reaction Playbook
A hub for reading expectation gaps, implied moves, guidance tone, and post-earnings price action.
Suggested reading path
- Read the implied move explainer first
- Then study good-results/bad-reaction setups
- Use fresh preview articles as live case studies
Core evergreen guides in this hub
- How to Read an Earnings Implied Move — Show how options pricing frames expectations into an earnings event.
- Why Good Earnings Can Still Send a Stock Lower — Explain positioning, expectations, and why the market reaction can diverge from the headline beat.
- How to Judge Catalyst Quality — Separate confirmed catalysts from weak headline narratives, flow-only moves, and low-conviction tape action.
Glossary anchors: implied move, guidance, beat rate, expectation gap
Nothing in this article should be construed as a recommendation to buy or sell any security. Past performance does not guarantee future results.


