🇺🇸 US Market CLOSED Tue, Apr 28 &0428pm5506; 6:26 PM EDT
Data: SEC · EDGAR · FRED · Yahoo Finance

Kforce (KFRC) Up 43% on Earnings Results Or Guidance — Is the Rally Sustainable?

Updated: April 28, 2026 at 04:15 PM ET · Reading time: 4 min · Author expertise: Small-Cap Equity Analyst

Why trust us: We separate factual market inputs from interpretation and link our process below.

Methodology · Data sources · Editorial policy

KFRCKforce, Inc.
$45.93▲ +43.49%

Industrials · Staffing & Employment Services

Volume1.7M
Avg Volume282K
Market Cap$840M
Catalystearnings results or guidance

What happened:

Home Stock Movers KFRC Soars 43.5% as Q1 Earnings Reveal AI-Driven Growth Strategy Updated: April 28, 2026 at 04:15 PM ET · Reading time: 4 min · Author expertise: Small-Cap Equity Analyst Why trust us: We separate factual market inputs from interpretation and link our process below. Methodology · Data sources · Editorial policy 💼 Earnings Whisper & Guidance Context Quarter Est EPS Actual EPS Surprise 2026-03 $0.40 $0.46 ✓ Beat (+13.9%) 2025-12 $0.48 $0.43 ✗ Miss (-10.0%) 2025-09 $0.58 $0.63 ✓ Beat (+9.3%) 2025-06 $0.61 $0.59 ✗ Miss (-2.8%) 📅 Next Earnings: 2026-07-27 TBD · EPS estimate: $0.62 · Revenue estimate: $343M Data: Finnhub.

Move+43.5%
Price$45.93
Rel. volume6.0x
CatalystEarnings

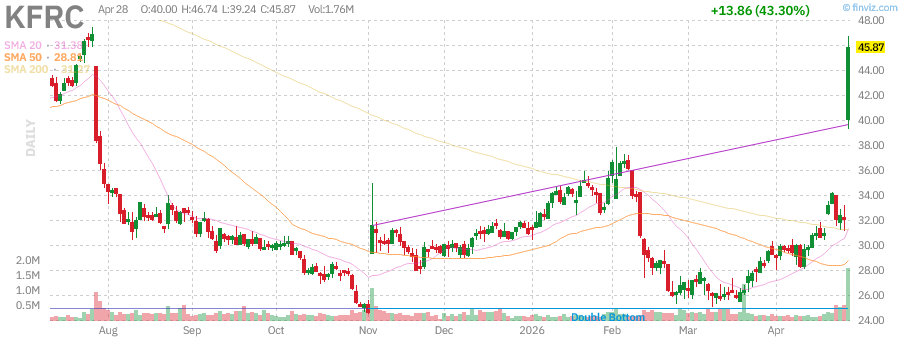
According to Yahoo Finance, Heads up — Kforce Inc (KFRC) shares spiked 43.5% following the release of their Q1 2026 earnings results; here is the breakdown of the move.

Kforce Inc (KFRC) surged 43.5% today to $43.98, driven by a decisive Q1 earnings beat and investor optimism regarding the company’s strategic pivot into artificial intelligence. This idiosyncratic move stands out because the broader market saw meaningful pressure, with the S&P 500 down 0.49% and the XLI (Industrials) lagging by 0.89%. The story here is one of specific operational success masking wider market weakness, with the stock delivering roughly 43.75% in alpha relative to its expected market move.

Our comfort level with this catalyst is high because the company provided clear commentary on its AI-related demand acceleration. The 8-K filed 2026-04-27 confirms that Kforce is moving from traditional staffing to higher-margin technology solutions, a shift that market participants are now aggressively pricing in.

What This Company Does

Kforce, Inc. is a professional staffing firm based in Tampa, Florida, with a focus on providing specialized talent solutions across the United States. Per SEC filings, the company operates through two primary segments: Technology and Finance and Accounting (FA). Their Technology business serves diverse industries—including financial services, communications, and retail—by providing experts in data management, cloud architecture, and machine learning. Per Wikipedia, the firm traces its history back to 1962 and maintains a workforce of approximately 1,600 employees.

The FA segment addresses demand for financial planning, general accounting, and administrative support. By connecting specialized consultants with client needs in sectors like healthcare and manufacturing, Kforce functions as a critical link in the domestic labor market. With a market capitalization of roughly $838 million, the company sits in the small-cap industrial space, specifically within the professional employment services industry.

Takeaway: Kforce is a US-based professional staffing firm focused on high-margin technology and finance talent solutions.

Why It Moved Today

The rally follows the latest 8-K and accompanying earnings commentary detailing growth in their technology segment. According to GuruFocus.com, the primary catalyst was the company’s explicit focus on strategic AI investments which is currently driving revenue expansion. This is not just a standard earnings beat; it represents a fundamental revaluation by investors who see the firm’s AI-enabled staffing as a durable competitive advantage.

My read on this move is that it is a blend of fundamental repricing and short covering. With 7.5% of the float held short, the sudden volume spike—hitting 6.0x the average daily level—forced rapid position liquidation. This adds a technical tailwind to the fundamental news. Worth noting: KFRC bucked the trend of its sector peers entirely, suggesting that the market is currently viewing the staffing industry through a highly bifurcated lens, favoring firms with technology-specific exposure over generalist players.

MetricValue
Trailing EPS$1.95
Forward EPS$2.86
Revenue (TTM)$1.33B
Revenue Growth0.10%
Gross Margin27.32%
Trailing P/E23.52
Why Kforce Stock Is Going to the Moon Today
Source: Motley Fool

Takeaway: Earnings-driven AI optimism and technical short-covering are the primary drivers for today’s +43.5% move.

Chart Setup and Key Levels

KFRC technical chart with RSI, MACD, Bollinger Bands
KFRC daily chart with SMA 20/50/200 and volume — source: Finviz, April 29, 2026 · Chart: Finviz

Daily Chart

The daily chart shows the RSI flashing deep into overbought territory at 81.62. While price is well above the 50-day SMA of $28.71, the extension is extreme. Historically, extreme RSI levels combined with high relative volume (6.0x today) often lead to mean reversion. We saw a similar analog on 2020-08-11, where an RSI of 84.5 on high volume resulted in a 5.1% decline over the subsequent 5-day period.

KFRC Daily Chart — 3-month view with SMA50/200

Weekly Chart

Weekly, KFRC has shattered its previous 20-day high resistance level of $46.74, trading aggressively into new momentum ranges. The stock’s position above the Bollinger upper band of $38.83 confirms the parabolic nature of the current surge. Sustained closing above this level would represent a technical breakout, though traders should monitor the current $46.74 resistance as a potential retest floor.

KFRC Weekly Chart — 1-year view with SMA50/200

Monthly Chart

Monthly context reveals KFRC is testing levels not seen in the recent period. What would confirm the validity of this move is a base-building phase above the $40 mark. Should the price fall back below $35, the current momentum thesis would be challenged, potentially invalidating the bullish narrative built on today’s earnings report.

KFRC Monthly Chart — 5-year view with SMA50/200
Takeaway: Watch the $46.74 resistance; holding above this is key to maintaining the current bullish momentum.

Outlook and Watchpoints

The near-term outlook depends on whether the market sustains the current AI-growth premium applied to KFRC. What would confirm this setup is a follow-through week with volume remaining at least 2x the 20-day average, suggesting institutional accumulation rather than speculative exhaustion. I’d lean cautious until I see the stock stabilize; massive gaps often invite profit-taking.

Conversely, what would invalidate this move is a retracement below the $38.83 Bollinger upper band. If the stock gaps down or loses that level, it would suggest the initial earnings excitement was purely headline-driven and lacked the fundamental support to sustain the 43.5% gain. I am watching for a retest of the $40 support level as a potential entry point for those currently on the sidelines.

3 Scenarios From Here

  • Bull: Sustains $46.74 support → Targets $50 by Q2 earnings release.
  • Base: Trades within $38 – $44 range → Next 2-3 weeks consolidation.
  • Bear: Breaks below $35.00 → Possible test of $28.71 SMA.

Risks

Before acting on today’s move in Kforce, Inc. (KFRC), consider key risks: momentum rallies can reverse sharply once the headline catalyst fades, particularly if volume thins on the follow-through session. Rate sensitivity and macro headwinds remain a systemic risk for the broader market. Position sizing and defined risk levels remain essential.

Watch for distribution signals — heavy volume on down days or gap fills — which would invalidate the bullish thesis. Any change in the original catalyst should trigger immediate reassessment.

Next Session Watchpoints

  • Volume profile: Watch whether KFRC keeps at least 6.0x average.
  • Key level to watch: Use today’s nearest actionable S&P 500 level from the supplied technicals and explain why it matters. is the pivot for continuation.
  • Catalyst quality: The move needs follow-through headlines or clean price acceptance above the pivot.
  • Risk trigger: If KFRC loses the opening range quickly, the move shifts from continuation to fade risk.

Frequently Asked Questions

Why did KFRC stock surge today?

KFRC stock climbed 43.5% primarily due to a positive Q1 earnings report and forward-looking guidance that emphasized strategic investments in artificial intelligence. This growth narrative convinced investors to revalue the company, resulting in significant volume and price action.

Is the KFRC move sustainable?

The sustainability of the move is uncertain, as the stock is currently in overbought territory with an RSI of 81.62. While the earnings catalyst is robust, historical analogs suggest that such sharp, volume-driven spikes often lead to a short-term period of mean reversion.

📚 Related Articles

Data sources: Yahoo Finance · SEC EDGAR · GuruFocus.com · MarketBeat · Zacks · StockStory


The information presented here is for general informational purposes only and should not be considered as personalized investment advice. All investing involves risk.

📊 Data Sources
yfinance · FRED (St. Louis Fed) · SEC EDGAR · Finnhub · World Bank · Wikidata
Last Updated: 2026-04-29 05:16 KST
This analysis uses public data sources. Investment decisions are your own responsibility.
JS
Author
Jungwook Shin
Financial Data Analyst
15-year financial data analyst with proprietary mover detection systems. Real-time catalyst analysis across US, Korea, and Japan markets.

프로필 보기 →

Leave a Comment

Your email address will not be published. Required fields are marked *

Scroll to Top
𝕏 ƒ in 🔗