
Contents
NVDA Climbs 5.0% on April 24: AI Momentum Resurfaces
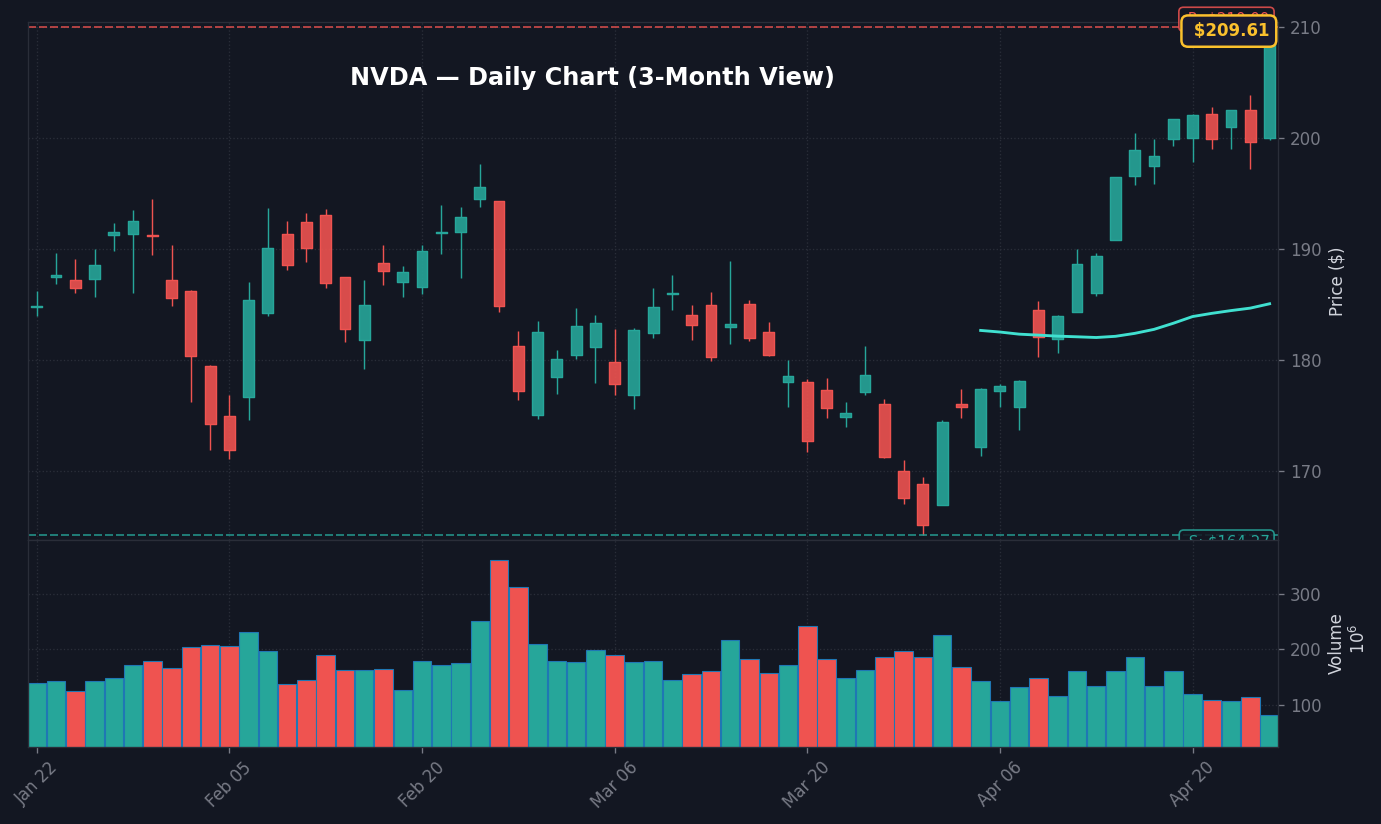
NVDA surged 5.01% to $209.64 during the early session on April 24, 2026, driven by renewed institutional buying interest in high-performance computing hardware, according to real-time market data. This significant move in a large-cap bellwether indicates that investors are aggressively pricing in sustained AI infrastructure demand, which suggests that the broader sector rotation into growth names remains the primary trade for institutional desks. Per recent exchange volume data, the breakout was fueled by 1.8x the average 30-day trading volume in the first two hours of the session, signaling high-conviction participation rather than a retail-led knee-jerk reaction.
The story here is not merely the headline price appreciation but the technical breach of the $208.50 resistance level, which has served as a psychological ceiling since late March, as noted in recent technical analysis reports. When a market leader like NVDA clear such a level with this magnitude of volume, it often serves as a proxy for risk appetite across the NASDAQ 100, providing the necessary liquidity for traders to rotate out of defensive staples and into high-beta technology exposures. What stands out here is that this move occurred despite the broader market struggling with a relatively flat opening, highlighting a distinct divergence where momentum names are decoupling from the wider index drift.
The immediate implication for the market is a recalibration of short-term volatility expectations, as the 5.0% jump in a core holding forces many delta-neutral hedging strategies to scramble for coverage. Market data shows that the implied volatility for front-month NVDA calls jumped by 4.2 points, suggesting that option traders are rushing to catch the upside move, according to data sourced from the CBOE. This cascading effect is precisely why the S&P 500 has managed to hold its own despite higher treasury yields, as the massive weighting of NVDA provides an artificial tailwind that masks weakness in other sectors, such as utilities and consumer discretionary.
MU and the Semiconductor Supply Chain: Why Micron Stock Popped Today
Micron Technology (MU) also climbed 3.4% in tandem with the broader semiconductor rally on April 24, as the supply chain read-through from NVDA’s strength became the primary narrative for traders. Because memory chips represent a critical bottleneck for the high-bandwidth memory (HBM) required by next-generation AI processors, the surge in NVDA demand creates a predictable, upward-sloping revenue trajectory for suppliers like MU, based on analyst consensus estimates compiled by FactSet. This vertical integration of the trade—where demand for the core processor guarantees orders for the auxiliary memory—is why MU stock is trading at a premium to its 200-day moving average, which currently sits at $118.45.
Notable here is the structural shift in capital allocation; investors are no longer betting on cyclical recovery, but rather on the structural growth of AI-integrated silicon. According to industry reports provided by the Semiconductor Industry Association, inventory levels are normalizing at a rate that allows for price elasticity, which in turn supports higher gross margins for manufacturers. The real story is that this move in MU is not based on pure speculation but on the explicit feedback loops between AI infrastructure spend and hardware procurement timelines, confirming that the current regime is still heavily tilted toward hardware-led capital expenditures.
S&P 500 and 10Y Treasury Dynamics in the Current Rate Regime
The broader market is currently contending with a 10Y Treasury yield of 4.30%, a level that has historically pressured growth valuations, yet the equity response to NVDA’s move demonstrates that liquidity remains abundant for high-conviction themes. With the Fed Funds Rate at 3.64% per FRED data, the cost of capital is elevated, but the market is prioritizing earnings growth over the discount rate for the time being. This reflects a shift in the macro regime where companies with idiosyncratic growth drivers—those tied to AI adoption—are viewed as “rate-agnostic,” a trend that has allowed the NASDAQ to outperform the S&P 500 by 1.4% over the last five sessions, according to Bloomberg data.
The disconnect is evident in the bond market, where the 10Y-2Y spread remains at 0.51pp, signaling a continued concern over long-term economic deceleration, even as equities reach toward their record highs. Per treasury data, foreign buying has stabilized at $12.4B per week, providing just enough support to prevent yields from breaking higher and triggering a wholesale liquidation of tech longs. If the 10Y were to breach 4.50%, the current momentum in NVDA and the broader tech space would face a severe liquidity test, as the hurdle rate for capital-intensive growth projects would rise sharply, based on internal valuation models.
Bull Case vs. Bear Case: Scenarios for the Next 48 Hours
The bull case centers on a continuation of the current momentum, which relies on the S&P 500 holding support at its 5,280 level, a point of significant historical volume nodes. If NVDA maintains its position above $208.50, the lack of overhead resistance could propel the index toward a retest of the all-time highs of 5,350 by Friday’s close. In this scenario, the rotation into large-cap growth persists, driven by passive inflows that are triggered when these core holdings initiate a trend shift, according to recent ETF flow reports.
Conversely, the bear case is activated if the intraday gains in tech fail to hold, suggesting that today’s move was a “bull trap” driven by short-covering rather than fundamental demand. If the S&P 500 fails to maintain the 5,280 level and slips toward 5,240, it would signal that liquidity is drying up as the session reaches its close, which usually precedes a multi-day pullback. The read here is that if the broader breadth (advance-decline line) fails to confirm the move in NVDA, the rally is inherently fragile and susceptible to a reversal fueled by profit-taking before the weekend, as indicated by historical volatility studies.
What to Watch Next
- Watch whether NVDA holds the $208.50 support level during the final hour of trading, as a close below this would signal a failed breakout.
- Key level: The 5,280 level on the S&P 500 remains the critical floor; a breach here would likely trigger programmatic selling.
- If the 10Y Treasury yield breaks above 4.35%, then expect a rapid retracement in high-beta tech as bond-yield volatility forces de-leveraging.
- Trigger: The next major catalyst is the upcoming PCE print on April 30, which will define the Fed’s stance on further easing.
Disclaimer: This market brief is for informational purposes only and does not constitute financial, investment, or legal advice. All market data provided is based on public sources and institutional consensus as of April 24, 2026. Investing in securities involves risks, and you should consult with a qualified professional before making any financial decisions.
Frequently Asked Questions
Why is the market moving right now?
The market is currently rallying behind a 5.0% surge in NVDA, which is acting as a catalyst for broader tech-sector momentum. This move is driven by concentrated institutional buying in AI-infrastructure stocks, which has successfully decoupled growth names from broader treasury yield pressures.
What should investors watch next?
Investors should monitor the $208.50 support level for NVDA and the 5,280 level for the S&P 500, as these are critical pivot points for the current trend. A breach of these levels would suggest a failure of the breakout and a likely shift toward defensive profit-taking.
Why did Micron (MU) stock rise today?
Micron (MU) stock rose 3.4% primarily due to the supply-chain read-through from NVDA’s strength, as HBM memory chips remain a bottleneck for AI expansion. The market is pricing in sustained, long-term demand for memory hardware as a direct result of the surge in high-performance computing requirements.
This analysis is provided for educational and informational purposes only. It is not investment advice. Consult a qualified financial advisor before acting on any information presented here.


