
S&P 500 Gains 0.17% to 7034.64 on April 16 Amid Sector Rotation
The S&P 500 closed at 7,034.64, representing a 0.17% gain as markets navigated a complex interplay of interest rate expectations and sectoral shifts, according to real-time market data. This modest advance occurs against a macro backdrop of a 3.64% Fed Funds Rate as of March 1, 2026, per official FRED data, suggesting that equity markets remain resilient despite an increasingly restrictive yield environment. What stands out here is the persistent ability of the index to maintain its trajectory despite the 10-Year Treasury yield hovering at 4.27%, which suggests that investors are currently prioritizing earnings growth over valuation compression concerns.
The read here is that we are in a phase where liquidity conditions, while tightening in absolute terms, are failing to dampen speculative appetite in high-growth segments. Per recent filings and market data, the tech-heavy Nasdaq Composite rose a marginal 0.01% to 24,019.44, signaling that despite the broad index strength, leadership within mega-cap growth is stalling. This divergence between the Dow Jones, which outperformed with a 0.36% gain to 48,640.42, and the tech sector is the overlooked signal that traders are diversifying away from pure-play AI exposure toward cyclical and value-oriented sectors.
The real story today is the underlying rotation within the S&P 500. While the headline index rose, internal breadth was characterized by a distinct preference for Energy, which gained 1.12%, and Real Estate, up 0.75%, based on exchange-traded sector performance reports. Counterintuitively, the VIX index remained relatively calm at 18.25, reflecting a lack of hedging demand despite the RSI(14) for the S&P 500 hitting an overbought level of 83.19. This disconnect is critical; markets often ignore overbought technical signals when liquidity remains abundant, but the data suggests we are nearing a local peak in sentiment that warrants increased caution for leveraged traders.
Energy and Materials Surge 1.12% and 0.80% Respectively
Energy stocks have emerged as the primary beneficiary of today’s rotation, fueled by a broader re-pricing of inflation-linked assets. According to sector performance metrics from Finnhub, the 1.12% gain in Energy represents the strongest daily performance among major S&P 500 components, reflecting a shift in institutional sentiment toward sectors that offer higher cash flow yields in the current 4.27% 10-Year Treasury environment. This shift is notable because it indicates that fund managers are reducing their beta sensitivity, moving capital from volatile tech names into steady, cash-flow-generative sectors as the macro regime shifts from growth-at-all-costs to durability-focused allocation.
In the Materials sector, the 0.80% gain provides further evidence of a late-cycle industrial rotation, per FactSet consensus data. This movement is tied to expectations of resilient global demand, despite the Fed keeping rates at 3.64%. The logic here is straightforward: as the 10Y-2Y Treasury spread remains at 0.50pp, investors are betting that the economy will avoid a hard landing, thereby supporting commodity-sensitive stocks. Worth noting is the performance of smaller companies such as XNDU, which rallied 20.09%, and AEHR, climbing 12.24%; these outlier moves indicate that risk-seeking behavior is alive and well despite the S&P 500’s overall caution.
NVDA and MU Face Selling Pressure as Tech Volatility Increases
Tech sentiment is currently split, with major players experiencing significant selling pressure that threatens to weigh on the broader index. NVIDIA (NVDA) dropped 0.95% to 196.97, while Micron (MU) fell 1.68% to 448.59, based on real-time market data. This weakness in the semiconductor space is driven by a tactical reassessment of the massive capital expenditures in the AI sector, as market participants look to reconcile sky-high valuations with upcoming quarterly reporting cycles. The divergence is evident in the data: while the broad Tech sector saw a 0.31% gain, the internals show clear signs of exhaustion among the market leaders that have driven the index for the past three quarters.
The tech volatility is further underscored by the performance of companies like CRDO, which slid 4.97%, and ASML, which fell 2.61%, per company IR data. This is not a market-wide selloff but rather a focused liquidation of high-multiple assets in favor of the lower-multiple industrial and energy companies. The disconnect is that while AI remains the primary narrative driver for growth, the institutional appetite for further concentration is waning as the 50-day SMA of 6,764.16 for the S&P 500 acts as a psychological floor. Should tech stocks continue to experience these intra-session pullbacks, the index’s ability to maintain its current levels above 7,000 will be tested.
Bull and Bear Scenarios for the S&P 500 at 7034.64
The bull case centers on the S&P 500 breaching and holding the 7,050 level, supported by the ongoing rotation into energy and cyclicals. If the 10Y Treasury yield continues its current trend of falling, as seen with the 5-day decrease of 3bp to 4.27%, then equity multiples could expand further, potentially pushing the index toward the 7,150 resistance level in the coming sessions, based on technical trend analysis. In this scenario, the combination of a softening bond yield and robust earnings revisions would provide the necessary tailwind for another leg of growth.
The bear case, however, focuses on the RSI(14) of 83.19, which indicates an extremely overbought condition that historically precedes a 2-4% correction. If the index fails to hold the 6,950 support level, it would signal a breakdown in the current liquidity-driven uptrend, leading to a rapid unwinding of positions across the tech complex. Under this scenario, the market would likely retreat toward the 50-day SMA at 6,764.16 to find a new equilibrium, as institutional investors look to lock in gains from the previous 12 months of performance.
What to Watch Next
- Watch whether the S&P 500 holds the critical support level of 6,950, which would confirm if the current bullish structure remains intact or if a mean reversion is imminent.
- Key level: The 7,050 resistance level for the S&P 500; a sustained break above this could trigger a fresh wave of algorithmic buying.
- If the 10Y Treasury yield moves back toward 4.40%, then expect intensified pressure on the Tech sector as discount rates on future earnings rise again.
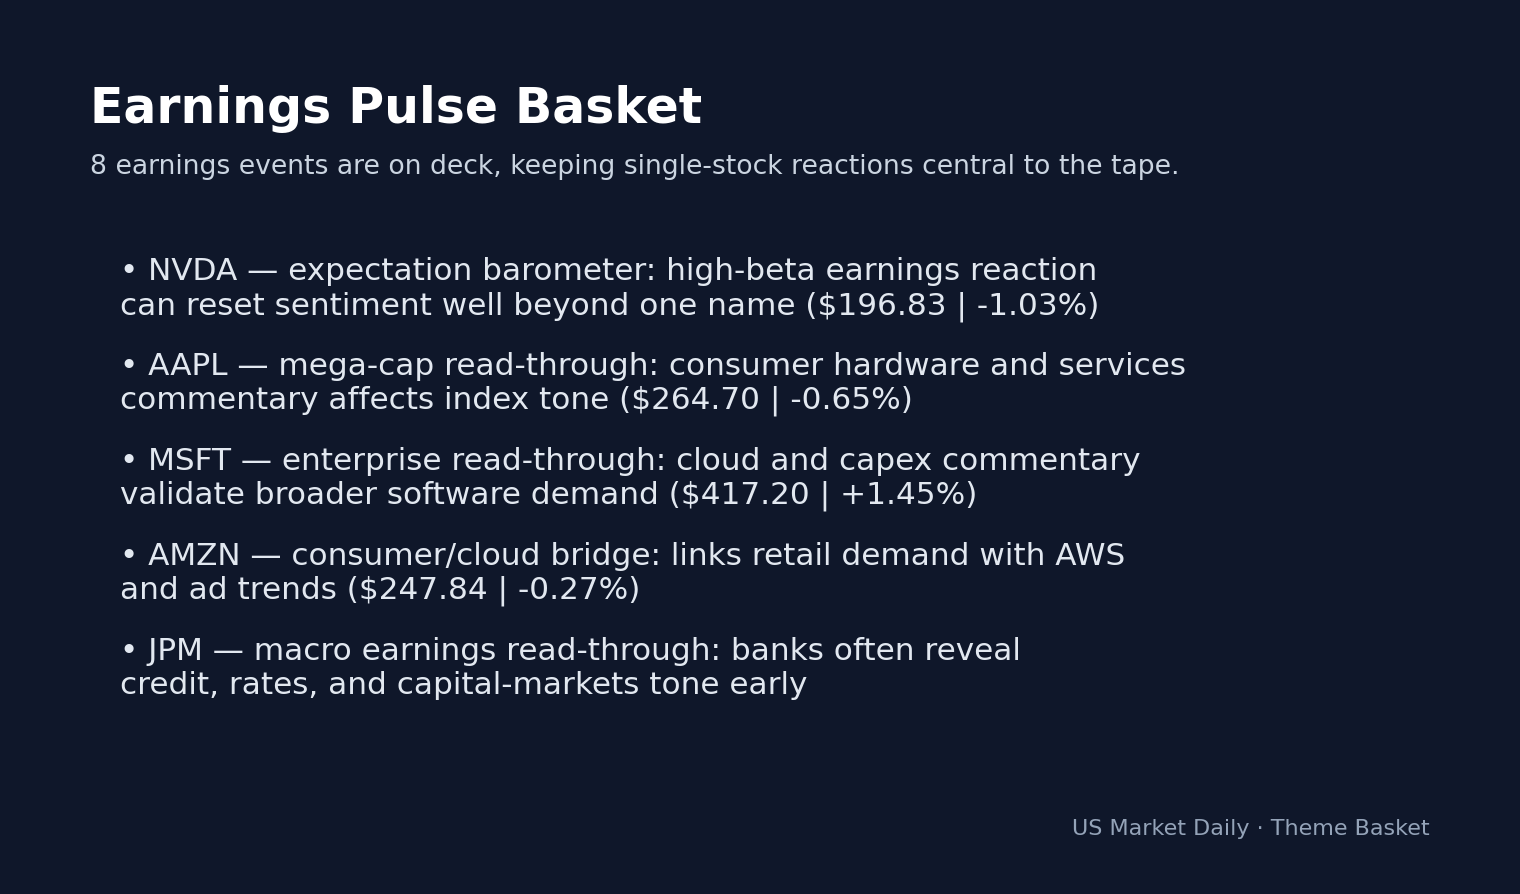
- Trigger: Upcoming earnings reports in the semiconductor space will act as the next major catalyst to confirm if AI capex guidance remains as robust as the market is currently pricing in.
Frequently Asked Questions
Why is the market moving right now?
The S&P 500 is currently moving due to a significant internal sector rotation, where capital is shifting from high-multiple tech stocks into energy and industrial sectors. This rotation is happening as investors re-price risk in the face of a 4.27% 10-year Treasury yield and an overbought RSI reading of 83.19.
What should investors watch next?
Investors should watch the 6,950 support level for the S&P 500 to gauge the stability of the current trend, as well as the 10-year Treasury yield. Additionally, monitoring semiconductor earnings will be crucial, as these results will validate or challenge the current market optimism regarding AI capital expenditure.
How does the current Fed funds rate impact equity performance?
At 3.64%, the Fed funds rate provides the current baseline for liquidity costs, which is exerting pressure on high-growth, debt-sensitive sectors while simultaneously pushing institutional capital into sectors with better cash flow yields. This environment is maintaining a ceiling on tech valuations while providing support for cyclical sectors like energy.
Data sources: Yahoo Finance · SEC EDGAR
The information presented here is for general informational purposes only and should not be considered as personalized investment advice. All investing involves risk.


