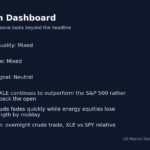
10:11 AM ET shows Technology down 1.20% while Real Estate is up 2.20%, making this market alert about rotation, not index panic, per Market Data.
The first-order consequence is clear: capital is moving away from long-duration technology and into yield-sensitive and defensive pockets, with the Nasdaq Composite at 25,013.98, down 0.49%, while the Dow Jones is up 0.27% at 51,850.94, per Market Data. The supplied breaking-event feed does not identify a named headline, so the cleanest read is not a single-company shock; it is a high-priority tape signal led by sector dispersion.
The key risk is that traders mistake the first knee-jerk move for the full market message before liquidity and confirmation arrive. The S&P 500 is nearly flat at 7,407.32, down 0.01%, but it remains below its 50-day SMA of 7,471.92, which makes 7,471.92 the nearest actionable level for whether this market alert fades or spreads, per Market Data.
The flow signal is sector spread, not index direction. Real Estate leads at +2.20%, Communication is up 1.01%, Energy is up 0.96%, Healthcare is up 0.65%, and Consumer Staples is up 0.59%, per Market Data. Technology is the only listed sector in the red at -1.20%, which puts the market alert in the category of rotation rather than broad de-risking.
Real Estate leading while the 10-year yield is quoted at 4.68% suggests traders are reacting to the direction of the rate move, not just the absolute level, per Market Data. REITs and data-center real estate names are especially sensitive to funding costs and long-duration cash flows. That helps explain why DLR is up 13.36% at 203.29 and EQIX is up 6.36% at 1,099.25, per Market Data.
The overlooked read-through is that the market is separating AI infrastructure landlords from AI compute suppliers. DLR and EQIX are rallying, while NVDA, AMD, AVGO, TSM, MU, CRDO, ALAB, COHR, and AAOI are lower, per Market Data. That split says investors may still want data-center exposure, but they are rotating toward assets with rent-like cash flows and away from hardware names where expectations may have been priced too tightly.
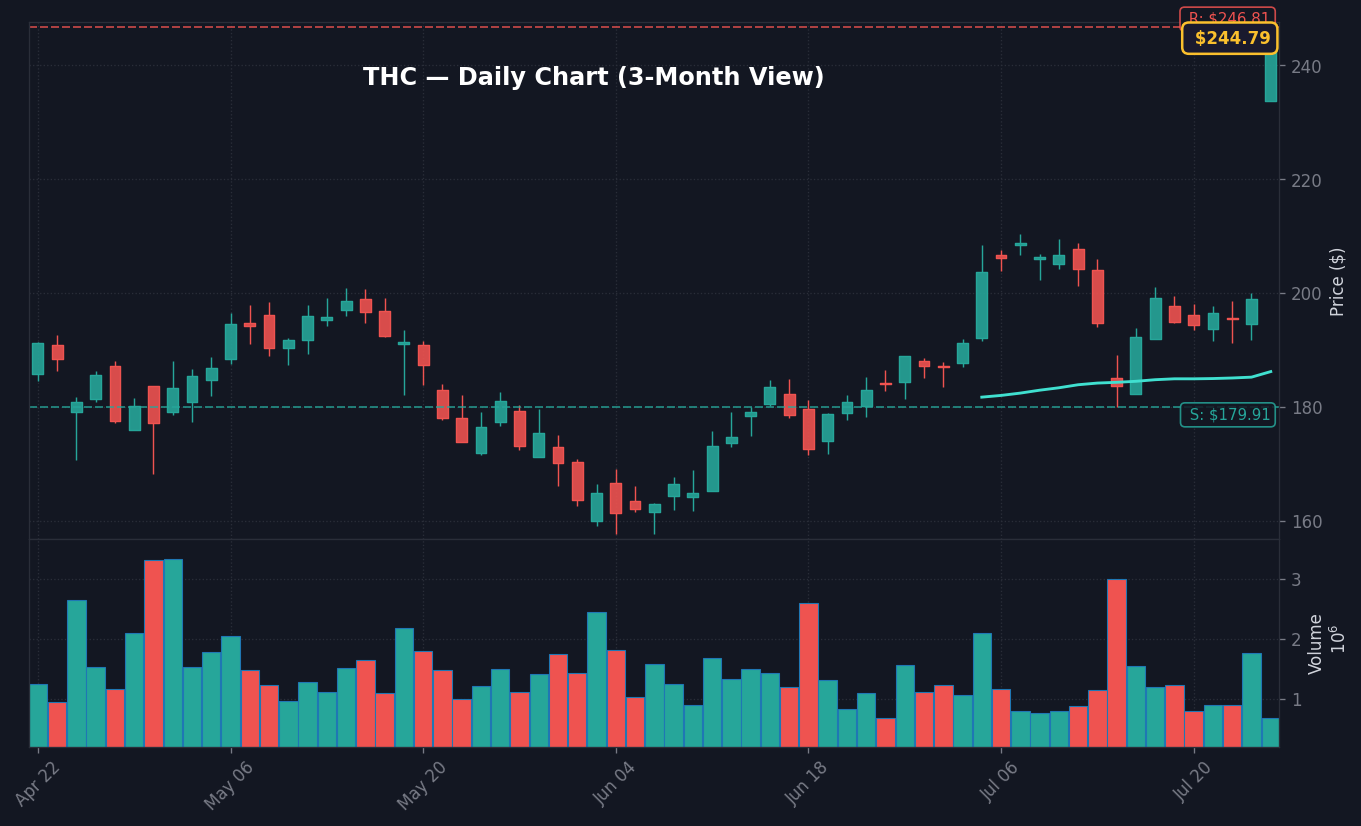
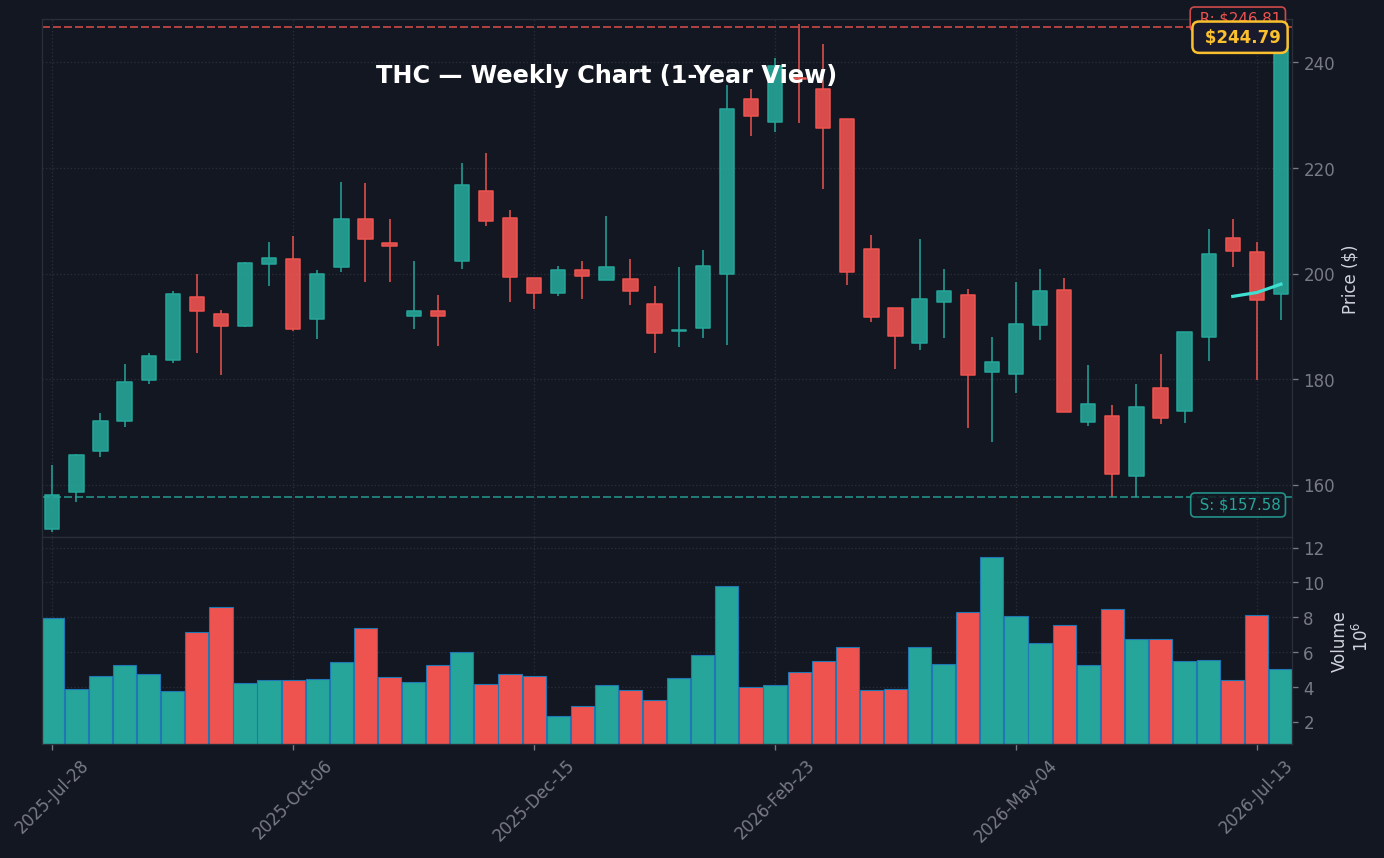
Healthcare also has a clean bid. THC is up 22.49% at 243.78, UHS is up 5.93% at 160.24, HCA is up 4.42% at 393.14, and SGRY is up 7.02% at 16.29, per Market Data. In a morning where Technology is down 1.20%, that healthcare bid looks less like random stock picking and more like a preference for domestic, cash-flow-visible earnings streams.
Energy is up 0.96%, with SLB up 8.69% at 51.33, per Market Data. That adds a second message: this is not a pure recession scare. If investors were pricing a demand shock, Energy would be expected to lag. Instead, the sector is positive, which supports the view that today’s pressure is concentrated in valuation-sensitive growth and semiconductors.
How Important Is S&P 500 Level 7,471.92?
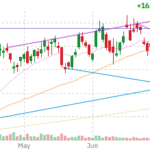
THC Weekly Chart — 1-year view with SMA50/200
The S&P 500 is at 7,407.32, below its 50-day SMA of 7,471.92, per Market Data. That 7,471.92 line is the nearest actionable level because it defines whether the index can reclaim trend support or whether the technology selloff starts to pull the broader market lower.
The technical picture is not washed out. RSI(14) is 38.41, which the supplied indicators classify as neutral, and the Bollinger Band position is inside, per Market Data. MACD is 0.923 versus a signal line of 15.3735, with no crossover listed, per Market Data. That means there is stress, but not a supplied capitulation signal.
Counterintuitively, the S&P 500 being down only 0.01% is not automatically bullish. It can be bullish if breadth continues to offset Technology, but it can also be a warning that index-level damage has not yet caught up to weakness in semiconductors and AI hardware. The market alert becomes more serious if 7,407.32 fails to hold while Nasdaq breadth stays weak.
The Dow’s 0.27% gain at 51,850.94 helps explain why the S&P 500 is holding up, per Market Data. Dow strength suggests money is rotating into old-economy and cash-flow names rather than leaving equities entirely. The danger is that if Technology remains under pressure after 10:11 AM ET, passive index flows can turn what is now a sector problem into a broader benchmark problem.
NVDA, AMD, TSM: Where the Tech Pressure Is Concentrated
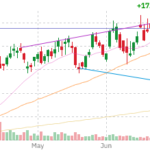
THC Monthly Chart — 5-year view with SMA50/200
NVDA is down 0.65% at 207.41, AMD is down 2.87% at 524.18, and TSM is down 2.37% at 405.74, per Market Data. That trio matters because it covers AI accelerators, competing compute exposure, and foundry supply, so weakness across all three points to a broader semiconductor de-risking move rather than an isolated ticker event.
AVGO is down 2.60% at 382.28, MU is down 6.18% at 929.05, WDC is down 5.23% at 529.11, and STX is down 3.78% at 878.86, per Market Data. Memory and storage weakness deepens the message. The market is not simply trimming one AI leader; it is marking down multiple parts of the compute supply chain.
What the tape is not pricing yet is the possibility that data-center beneficiaries split into two baskets for the rest of the session. The first basket is hardware, where expectations and valuation sensitivity are heavy. The second basket is facilities and infrastructure real estate, where DLR and EQIX are rallying sharply. If that split holds into the afternoon, it becomes a cleaner sector-rotation trade than a standard tech selloff.
SAFT +41.29% and THC +22.49% Show Stock Picking Is Still Alive
SAFT is up 41.29% at 103.06, and the available source list includes “Why It Might Not Make Sense To Buy Safety Insurance Group, Inc. (NASDAQ:SAFT) For Its Upcoming Dividend” under market data context. The prompt does not provide the underlying SAFT catalyst, so the article cannot state why SAFT is up beyond the supplied market move.
THC is up 22.49% at 243.78, RNG is up 21.21% at 46.81, DLR is up 13.36% at 203.29, WKC is up 13.15% at 41.04, and BAH is up 13.02% at 74.44, per Market Data. Those gains matter because they show this is not a market where all beta is being sold. The bid is selective, and that makes the alert more about allocation than panic.
The judgment here is simple: when single-stock gainers are up 20% to 40% while the Nasdaq is down 0.49%, traders should avoid treating the morning as one-directional risk-off. The opportunity set is shifting across sectors, not disappearing. The mistake would be assuming that a red Nasdaq means every growth, healthcare, real estate, and communication-services exposure carries the same message.
Communication is up 1.01%, with GOOGL up 1.43% at 322.24, VZ up 2.82% at 45.05, T up 2.83% at 23.61, and CMCSA up 1.64% at 22.28, per Market Data. That is another sign that the selloff is not a blanket rejection of mega-cap or large-cap exposure. It is more targeted: hardware-heavy technology is under pressure while cash-flow communication names are holding a bid.
3 Scenarios for the S&P 500 After 7,407.32
3 Scenarios From Here
Bull: S&P 500 reclaims the 50-day SMA at 7,471.92 while Technology narrows its -1.20% loss → the rotation stays orderly and the index retests the 7,471.92 trend line by the next confirmation window.
Base: S&P 500 holds near 7,407.32 while Nasdaq Composite remains down around 0.49% → the tape stays rotational, with Real Estate, Communication, Healthcare, and Energy offsetting tech weakness through the July 24 session.
Bear: S&P 500 loses 7,407.32 and Technology remains the only negative supplied sector → the market alert broadens from sector rotation into index pressure, with the 7,407.32 cash level becoming the downside trigger.
The asymmetry is not about whether stocks are green or red at 10:11 AM ET. It is about whether a narrow technology drawdown becomes a broader benchmark drawdown. The bull case needs confirmation above 7,471.92; the bear case needs confirmation below 7,407.32. Anything between those two levels is a rotation tape, not a completed market verdict.
The base case deserves respect because VIX is down 0.37% at 18.63 while the Dow is higher by 0.27%, per Market Data. A falling VIX during a Nasdaq drawdown usually means hedging demand is not accelerating. But VIX is still above the 20-day average of 16.8, per FRED data, so traders should not confuse lower volatility on the screen with a low-volatility regime.
Why This Market Alert Is Not Confirmed Yet
The supplied breaking-events field is empty, and no official event trigger is listed. That matters because without a named Fed, BLS, EIA, SEC, company filing, or earnings-release catalyst in the prompt, the move should be treated as a high-priority market alert driven by observable price action rather than a confirmed headline with a known cause.
That does not make the signal irrelevant. Market Data shows Nasdaq Composite down 0.49%, Nasdaq 100 futures down 0.96%, Technology down 1.20%, and Real Estate up 2.20%. Those are meaningful enough to explain the immediate market consequence. But the causal chain stops at sector rotation unless a named catalyst arrives.
This is where experienced traders separate price discovery from narrative chasing. The initial move says growth and semiconductor exposure are being reduced. It does not yet say why. Until a named catalyst appears, the higher-quality read is to follow confirmation: S&P 500 versus 7,471.92, VIX versus 18.63, Nasdaq futures versus 28,345.25, and whether Technology remains the only red sector.
Sticky inflation keeps the upside case constrained. Fed funds at 3.63%, CPI at 3.7% year over year, the 10-year near 4.67% to 4.68%, and unemployment at 4.2% do not describe a backdrop where the Fed can quickly rescue every growth-stock drawdown, per FRED data and Market Data. That is why the rotation has teeth even with the S&P 500 almost flat.
What to Watch: S&P 500 7,471.92 Reclaim
Watch whether the S&P 500 can move back above its 50-day SMA at 7,471.92 after trading at 7,407.32 at 10:11 AM ET, per Market Data.
Key level: 7,471.92, the S&P 500 50-day SMA; failure to reclaim it keeps the index below trend support.
If Technology remains down near -1.20% while Nasdaq 100 futures stay near 28,345.25 then the alert remains a growth-led de-risking signal rather than a simple intraday wobble.
Trigger: Next hard catalyst is confirmation from live market data after the 10:11 AM ET July 24 print; the prompt provides no named official release or company event time.
Next Session Watchpoints
Volume profile: Watch whether THC keeps at least 0.7x average.
Key level to watch: Use today’s nearest actionable S&P 500 level from the supplied technicals and explain why it matters. is the pivot for continuation.
Catalyst quality: The move needs follow-through headlines or clean price acceptance above the pivot.
Risk trigger: If THC loses the opening range quickly, the move shifts from continuation to fade risk.
Frequently Asked Questions
Why is Nasdaq down on July 24, 2026?
The Nasdaq Composite is down 0.49% at 25,013.98 while Technology is down 1.20%, per Market Data. The supplied breaking-event feed does not name a specific catalyst, so the verified signal is sector rotation away from technology rather than a confirmed official headline.
What S&P 500 level matters most after the July 24 market alert?
The key level is 7,471.92, the S&P 500 50-day SMA, per Market Data. The index is trading at 7,407.32, so a reclaim would support a contained rotation, while failure keeps the benchmark below trend support.
Why are Real Estate stocks rising while technology sells off?
Real Estate is up 2.20% while Technology is down 1.20%, per Market Data. DLR is up 13.36% and EQIX is up 6.36%, suggesting investors are favoring yield-sensitive and infrastructure-like cash flows over semiconductor and AI hardware exposure.
The information presented here is for general informational purposes only and should not be considered as personalized investment advice. All investing involves risk.